
Sector Research
The Forest, and the Trees: Investing in Timber
Forestry, timberland, and lumber. A deep dive on humanity's oldest capital resources.
Smart investing requires patience, and what could be more patient than watching trees grow? Owning timberland as an asset is one of those classics that don’t go out of style, but tends to go unnoticed unless you have a fascination with financial history.
While researching timberland as an asset class, I found a wealth of resources but very little hype. The overlap between “people who like forests” and “fascinated with money” is not very big these days.
To me, a lack of attention signals opportunity. There is both historical precedent and a strong modern case for timberland as a long-term holding and part of a diversified portfolio.
Sections to follow
First, I lay out a model for estimating timber returns, borrowed from a classic model for stock returns. Similar principles, very different mechanics.
Next, I walk through the three contributing factors to timberland investment returns, to check that assumptions built on the past can still hold up today. Then, thoughts about where timber fits into a diversified portfolio. Finally, I cover the easiest and most liquid ways to invest in timber: these days you don’t have to tromp around in the woods and get your boots muddy to benefit from forests as an asset.
Timberland is a time-tested capital resource, and people have been thinking about how to best manage forests for centuries. Let’s begin with some history, and Otto von Bismarck’s timberland investing model from the 19th century.
Modeling Timber Returns

“Bismarck’s appetite for timberland was insatiable.
His theory was that the price of land would gradually appreciate in line with population growth, or about two percentage points annually. His studies had convinced him that German forests would grow 2.75% a year, so that his real return for timberland would be around 4.75% per annum, because inflation at the time was virtually zero. If there was inflation, he was sure timberland and log prices would appreciate in line with the inflation. He thought that with very little risk, this was a spectacular compounding of wealth.
As it turned out, Bismarck was absolutely right.” (Biggs, 2006)
How do we forecast the potential return from investing in timberland? First, let’s consider stocks as a comparison.
For projecting long-term stock market returns, a classic Warren Buffett method is to sum the market’s dividend yield, plus real growth rate in earnings, plus inflation.
For example, in 1950 the S&P 500’s dividend yield was 6.9%; assume real earnings growth of about 2% and inflation of about 3%, and that is a projected equity return of 11.9%, a reasonable estimate of what an investor would have averaged over the following 70 years.
The S&P 500 compounded return (1950–2020) was 11.4%, closely matching the model; adjusted for inflation, the real return was about 7.7% per year. Starting yields are far lower today. In 2026 the S&P 500’s dividend yield is about 1.1%, or roughly 2.5% including share buybacks net of new issuance, which puts the same model’s real return projection for stocks at roughly 3–4.5%. (Sources: 1, 2, 3)
What I’ll call the “Bismarck Model” for timber follows the same pattern as the Buffett Model for stocks.
The investment return of timberland can be summed up as biological growth of the trees, real appreciation in the value of land, plus inflation, which drives up both the price of wood products and land prices.
Timberland Return = Biological Growth + Increasing Land Value + Inflation
Growth of trees and land values can be reasonably estimated, and I’ll spend the next few sections breaking those down to clarify the driving factors. Inflation is the big unknown.
Bismarck estimated a 4.75% real return on his timberland back in the mid-19th century, and I think that figure is still in the ballpark today.
My own estimate is a long-term 4% real return from timberland: 3.5% from biological growth, the rest driven by land value. To see where that estimate comes from, let’s walk through each of the three factors which make up a timber forest’s total investment return.
1) Biological Growth: On the Stump
Steady biological growth is an investment feature unique to timber. A model by J.P. Caulfield (1998) estimated that 60% of a timber investor’s return was from biological growth, 33% from product pricing (a.k.a. inflation) and the rest from land price, so arguably the biological factor is most important to understand.
Trees grow every year, no matter what the American consumer is thinking or what the Federal Reserve opines next month. The end value of lumber products varies with the economy, but an owner can leave timber “on the stump” and wait — building value all the while — to harvest when the time is right.
How fast do trees grow? It depends on the location, the type of tree, and how big they are. As an extra complication, biological growth is not the same as a tree’s growth in economic value: younger trees grow faster, but are least valuable when harvested right away. The smallest trees go for pulpwood in industrial applications; medium-sized trees are processed by “chip-n-saw,” which produces a combination of boards and pulp; the largest trees become sawtimber, useful as structural beams for building construction and other high-priced purposes.
| dbh (in.) | 4 rings | 5 | 6 | 7 | 8 | 9 | 10 | 11 | 12 | 13 | 14 | 15 rings |
|---|---|---|---|---|---|---|---|---|---|---|---|---|
| 4 | 0.282 | 0.225 | 0.188 | 0.161 | 0.141 | 0.125 | 0.113 | 0.102 | 0.094 | 0.087 | 0.080 | 0.075 |
| 5 | 0.220 | 0.177 | 0.147 | 0.126 | 0.110 | 0.098 | 0.088 | 0.080 | 0.073 | 0.068 | 0.063 | 0.059 |
| 6 | 0.181 | 0.145 | 0.121 | 0.103 | 0.091 | 0.080 | 0.072 | 0.065 | 0.060 | 0.056 | 0.052 | 0.048 |
| 7 | 0.153 | 0.123 | 0.103 | 0.088 | 0.077 | 0.068 | 0.061 | 0.056 | 0.051 | 0.047 | 0.044 | 0.041 |
| 8 | 0.133 | 0.106 | 0.089 | 0.076 | 0.067 | 0.059 | 0.053 | 0.048 | 0.044 | 0.041 | 0.038 | 0.035 |
| 9 | 0.116 | 0.093 | 0.078 | 0.067 | 0.058 | 0.052 | 0.047 | 0.042 | 0.039 | 0.036 | 0.033 | 0.031 |
| 10 | 0.105 | 0.084 | 0.070 | 0.060 | 0.053 | 0.047 | 0.042 | 0.038 | 0.035 | 0.032 | 0.030 | 0.028 |
| 11 | 0.095 | 0.076 | 0.063 | 0.054 | 0.047 | 0.042 | 0.038 | 0.034 | 0.032 | 0.029 | 0.027 | 0.025 |
| 12 | 0.087 | 0.070 | 0.058 | 0.050 | 0.044 | 0.039 | 0.035 | 0.032 | 0.029 | 0.027 | 0.025 | 0.023 |
| 13 | 0.080 | 0.064 | 0.053 | 0.046 | 0.040 | 0.035 | 0.032 | 0.029 | 0.027 | 0.025 | 0.023 | 0.021 |
| 14 | 0.074 | 0.059 | 0.049 | 0.042 | 0.037 | 0.033 | 0.030 | 0.027 | 0.025 | 0.024 | 0.021 | 0.020 |
| 15 | 0.069 | 0.055 | 0.046 | 0.039 | 0.034 | 0.031 | 0.028 | 0.025 | 0.023 | 0.021 | 0.020 | 0.018 |
| 16 | 0.064 | 0.052 | 0.043 | 0.037 | 0.032 | 0.029 | 0.026 | 0.023 | 0.021 | 0.020 | 0.018 | 0.017 |
| 17 | 0.061 | 0.048 | 0.040 | 0.035 | 0.030 | 0.027 | 0.024 | 0.022 | 0.020 | 0.019 | 0.017 | 0.016 |
| 18 | 0.057 | 0.046 | 0.038 | 0.033 | 0.029 | 0.025 | 0.023 | 0.021 | 0.019 | 0.018 | 0.016 | 0.015 |
| 19 | 0.054 | 0.043 | 0.036 | 0.031 | 0.027 | 0.024 | 0.022 | 0.020 | 0.018 | 0.017 | 0.015 | 0.014 |
| 20 | 0.051 | 0.041 | 0.034 | 0.029 | 0.025 | 0.023 | 0.020 | 0.019 | 0.017 | 0.016 | 0.015 | 0.014 |
| 21 | 0.049 | 0.039 | 0.033 | 0.028 | 0.024 | 0.022 | 0.020 | 0.018 | 0.016 | 0.015 | 0.014 | 0.013 |
| 22 | 0.046 | 0.037 | 0.031 | 0.027 | 0.023 | 0.021 | 0.019 | 0.017 | 0.015 | 0.014 | 0.013 | 0.012 |
dbh = diameter at breast height. Column headings are rings per radial inch. For %, multiply by 100. Source: Davies (1991).
The table boils down to a simple rule of thumb: a tree’s annual volume growth is roughly 4.2 divided by (rings per inch × diameter in inches). Young, fast-growing trees add volume at double-digit rates, while large, slow-growing trees add only 1–2% per year.
Optimal tree harvest time strikes some balance between rate of biological growth, change in economic value, and how future profits are discounted against the present (the interest rate). This equation is mathematically complicated but solvable, and people have been thinking about it for centuries, so best practices exist.
Bismarck estimated 2.75% growth in timber value per annum, but trees may grow faster than they did 150 years ago due to higher CO₂ content in the atmosphere. We also now have GPS, satellite imagery, and serious heavy machinery to help manage forests, making harvest patterns more efficient.
So what’s a reasonable estimate? Biological returns vary widely by tree type, region and management style. Chudy & Cubbage (2020) compile returns from recent timber studies around the world: setting aside the extremes, the eight U.S. projects average an IRR of 6.6%, and the 65 projects overall average 10.5%. These returns leave out the cost of buying the land, which flatters them; the authors note that including land lowers returns by about three percentage points for pine plantations in the U.S. South. For U.S. timberland, that implies a return from growing and harvesting trees of roughly 3.5%.
That 3.5% covers both volume growth and the value gained as trees grow into higher-priced size grades, and it is a reasonable estimate for a geographically diversified timber investment.
Biological growth is the main long-term driver of timber returns, but the value of each year’s harvest has a significant element of noise attached due to supply and demand in the lumber market, which we’ll look at next.
2) Price Inflation: Lumber Supply and Demand
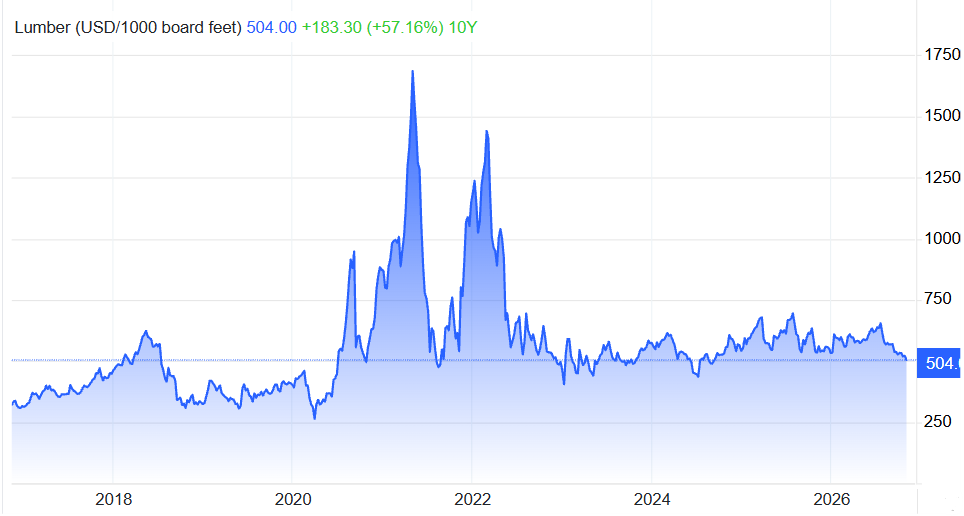
Lumber prices vary year to year, but the long-term trend roughly follows the general price level. Over the 10 years shown, lumber prices compounded at about 4.6% per year, against CPI inflation of about 3.4%. That gap is sensitive to the start and end dates, though: lumber is volatile, and the 2021–2022 spike shows how far supply disruptions can push prices away from trend.
When I read articles about investing in timber, often it’s framed as a play on lumber prices and near-term housing demand. In the Bismarck Model, the prices for wood products are assumed to increase only as fast as the general rate of inflation, but if prices were to increase faster than that, it would show up in superior long-term returns for timberland owners.
Historically, a large share of wood production was for paper making and cardboard. Now, American consumption of paper is in steady decline as more business activity goes digital.
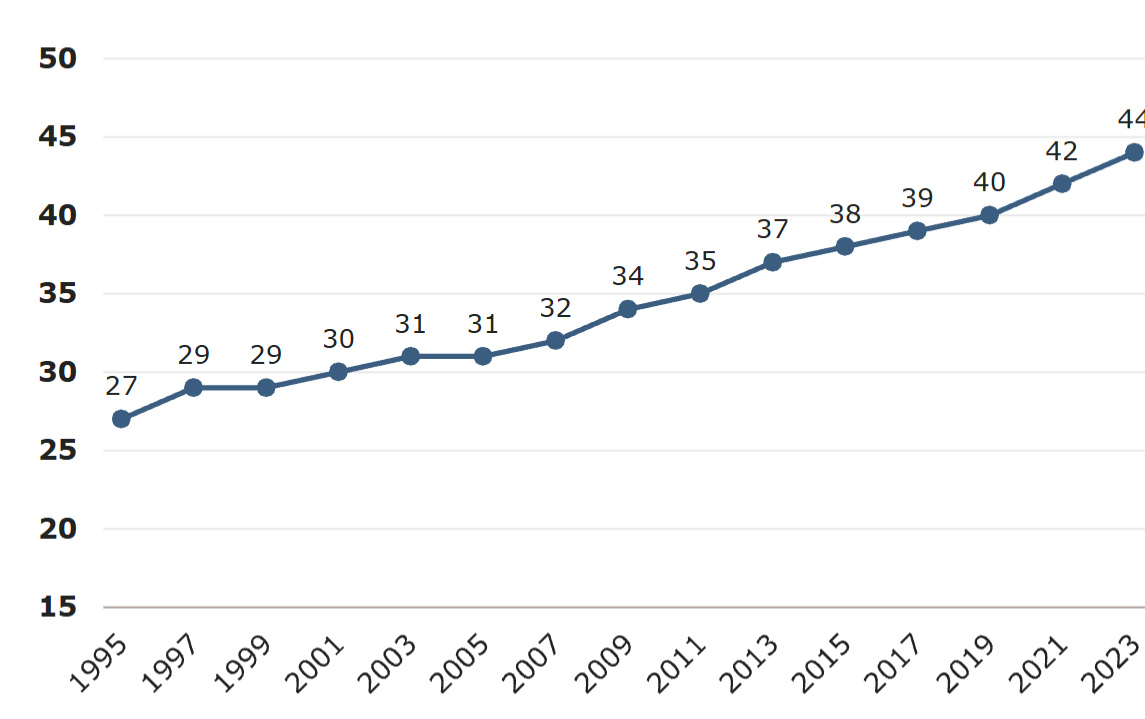
Most lumber goes toward new home building plus DIY or professional home improvements. After the Financial Crisis in 2008 revealed an overinvestment in housing, the big homebuilders pulled back on activity and new house starts dropped significantly. The lagged effect is that housing supply has not kept up with demand, and the U.S. housing stock is getting older.
Houses are Getting Older, and New Builds Aren’t Keeping Up
Environmental Optionality
I see most timber end-markets as stable or growing only slowly, but there are increasingly more options for timberland owners to be paid not to cut trees.
Forests are carbon sinks which pull CO₂ from the atmosphere while they grow. Airlines, oil drillers, and other industries which emit CO₂ are under pressure to offset their emissions, or to pay someone else to maintain and monitor forest carbon offsets for them. Timberland owners are positioned to capture a big share of this trade.
Forest land may also be used for siting solar farms or doing carbon sequestration (capturing and storing carbon underground). In many cases this leaves the above-ground timber still a harvestable resource.
3) Land: The Dirt Underneath
“Zebulon White, a pioneer in the field of forestry investments, recounted the pointed advice given him by a supervisor in the piney woods of Arkansas in 1940: ‘Be careful when you buy those timber deeds that they don’t slip the land in with it.’” (Zinkhan, 1992)
Historically, the dirt that trees grow on was the least meaningful part of a forest asset, but over time that may be changing.
There is no uniform index of timberland value because the price of a forest acre depends on where it is located, the type of trees on it, how old they are, and so on. However, we can use industry estimates of how land values in different regions have grown over time.
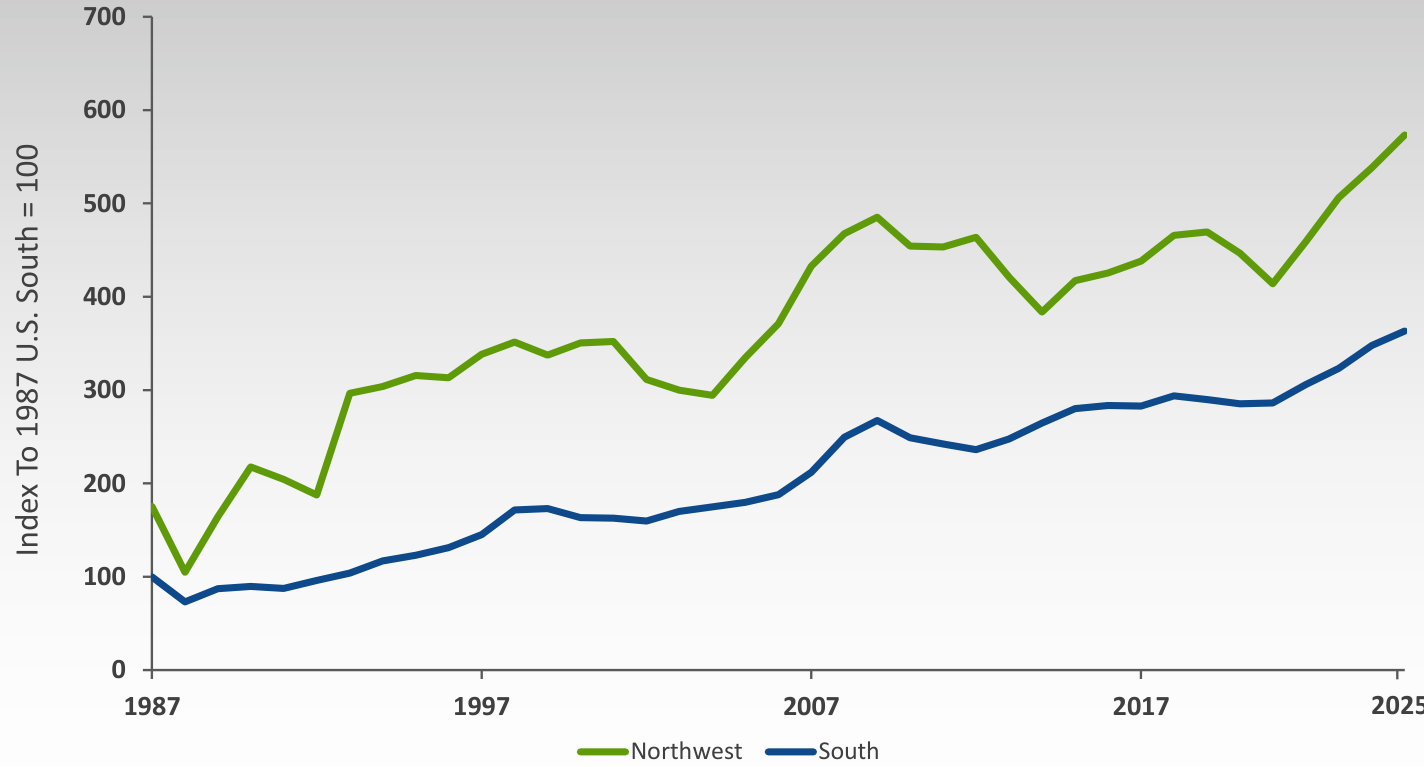
How fast does timberland appreciate? NCREIF’s index of timberland market value per acre suggests modestly. From 1987 to 2025, values per acre grew roughly 3.2–3.5% per year in the U.S. South and Pacific Northwest, against inflation of about 2.75%: a real gain of roughly 0.5% per year. That figure includes the value of standing timber as well as the land itself, but it is a reasonable anchor for the land component of the Bismarck Model.
In the United States there are about 765 million acres of forest, and 42% of that is owned by federal, state and local governments. Of the forests owned by private parties, about two thirds are theoretically suitable for timber production.
Timberland supply is not as elastic as you might expect, though, because location matters. Most logs travel less than 100 miles to be processed. Wood is heavy and awkward to move, so timber near a processing site is more valuable. There are significant costs to make a remote, inaccessible forest viable for lumber production, and beyond some distance from population centers, that cost just isn’t worth paying.
Timberland and sawmills ideally want to be close to where the end products will be used or shipped, but this puts them in competition with other demanders for land.
Population growth near wooded areas lets marginally productive timberland be sold for urban development. Conversions for “higher and better uses” (HBU) are a profit source for timber owners, who sell desirable land closest to urban centers while buying at lower cost farther away. As cities grow outward, these opportunities expand. It’s a recurring arbitrage.
Forestland near population centers can also be used for secondary purposes while still being available for timber operations. In some parts of the South, Munn & Hussain (2014) estimated that as much as 18% of timberland value was driven by the ability to lease to deer and elk hunters.
Other recreational uses like camping or off-roading add small extra revenue streams for timberland owners. In this variety of ways, growing population near forested areas causes more demand for access to land, and that is capitalized into prices.
Timber in a Portfolio
“If you plant trees that are going to be harvested in a hundred years it is only logical to think of other things that may be happening then.” — George Weyerhaeuser (1969)
Timberland investors face some risks that common stock owners don’t have to think about. Wildfires, weather, disease, or other natural disasters can destroy forests. In British Columbia, a pine beetle infestation has ruined millions of acres of lodgepole pine, causing huge losses to landowners.
From a portfolio perspective, though, what we care about is that the risks which threaten a timber investment are significantly different from, and less correlated with, the rest of the market.
Biological growth and forest land values operate on a different axis than corporate earnings growth, which drives general stock market returns. Historically, owning timber REITs has been no less volatile than the overall market, but volatile in different ways, which is a benefit.
Hedging Inflation
The conventional “Buffett Model” for long-term stock returns assumes that stocks will rise at the same rate as inflation. Companies price up their products as input costs grow, so in theory, real return remains the same regardless of inflation — in the long term.
Over shorter time periods, companies may face headwinds from inflation if their costs rise but they can’t pass them on right away. Customers resist price increases, and government can push back with “anti-gouging” laws. When inflation spikes unexpectedly, earnings may fall and cause losses to stockholders, as in 2022.
Timber owners, on the other hand, sell a commodity whose price tends to move with the general price level, and integrated producers can keep their margins in line with inflation.
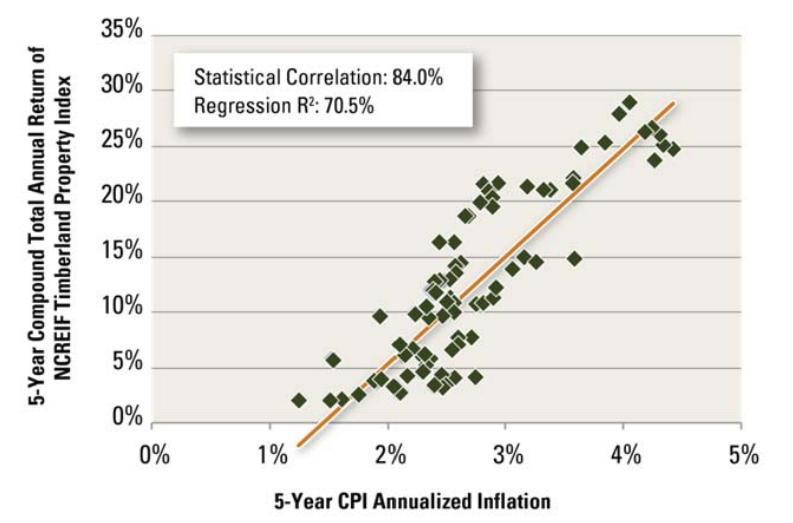
Historically, timber returns have neatly tracked the inflation rate, shown in the graph above.
We don’t have comprehensive records for timber returns in periods of very high inflation, such as Germany in the early 20th century or America in the 1970s. However, judging from anecdotes and history books, timberland has been a great preserver of wealth in times when inflation was ruinously high. Just ask the Bismarcks!
How to Invest in Timber
How does one add timberland exposure to an investment portfolio? There are a few ways, but some are more practical than others.
Most simply, you could buy private forested land and manage it yourself. Popular YouTubers talk about the journey of self-managing timber lots. You’ll get good exercise and lots of sun as part of the bargain, but personally I prefer a more passive approach for my investments.
Institutions and ultra-high-net-worth investors have access to Timber Investment Management Organizations (TIMOs), which own and operate large private forests. These are inaccessible to most of the investing public.
Options for investing in timber through the stock market have, happily, improved. Starting in the late 1990s, old-school sawmill companies which also owned lots of forest acreage began reorganizing into Real Estate Investment Trusts (REITs) whose primary business is managing timberland, although most kept their sawmills or other integrated operations on the side.
On the U.S. market there are two timber REITs available to invest in, each of which emphasizes different parts of the timber return equation.
Weyerhaeuser (WY) is the larger of the two, owning about 10.3 million acres in the U.S. and managing another 13 million acres in Canada under long-term government licenses. WY operates a significant vertically integrated sawmill and wood products business, so its earnings are more leveraged to end-market prices.
Rayonier (RYN) is smaller, owning about 4.1 million acres. Previously a pure play on timber management, Rayonier merged with PotlatchDeltic in January 2026, adding six sawmills and a plywood mill in the Northwest and South. Even so, Rayonier remains more focused on land management, and it also does substantial real estate development in the U.S. South.
One complication is that the market tends to treat both timber REITs as a proxy for housing and lumber demand, adding a layer of volatility that has little to do with the Bismarck return model discussed above. Depending on your perspective, those share price fluctuations can be either an annoyance or an opportunity.
Summary
Making the case for timber, I’ve argued that:
- Timber returns can be modeled with the same building blocks as stocks, with biological growth and land appreciation in place of dividends and earnings growth, plus inflation;
- New factors, specifically the growth of carbon offsets and alternative land uses, may cause timber to be an even more attractive investment than it was historically; and
- Timberland has diversification benefits, especially in a world where inflation is high.
While timber REITs are a highly liquid and accessible way to add this exposure to a portfolio, an investor still has to consider the appropriate valuation to pay for a timber REIT (like any asset, the price paid will determine future return), which company’s management style best matches the macro environment, and how high the allocation to timber should be.
References and Further Reading
- Baral, Srijana, and Bin Mei. “Development and performance of timber REITs in the United States: a review and some prospects.” Canadian Journal of Forest Research (June 14, 2021).
- Biggs, Barton. Hedgehogging. John Wiley & Sons, 2006.
- Caulfield, J. P. “Timberland Return Drivers and Investing Styles for an Asset that has Come of Age.” Real Estate Finance 14 (Winter 1998).
- Chudy, R. P., and F. W. Cubbage. “Research trends: Forest investments as a financial asset class.” Forest Policy and Economics (October 2020).
- Cubbage, Frederick, et al. “Global timber investments, 2005 to 2017.” Forest Policy and Economics 112 (2020).
- Davies, Karl. “Field Note: Forest Investment Considerations for Planning Thinnings and Harvests.” Northern Journal of Applied Forestry 8, no. 3 (September 1991).
- Fu, Chung-Hong. “Timberland Investments: A Primer” (2014).
- La, Le, and Bin Mei. “Portfolio diversification through timber real estate investment trusts: A cointegration analysis.” Forest Policy and Economics (January 2015).
- Lutz, Jack. “Biological Growth Rates and Rates of Return.” Forest Research Notes 2, no. 3 (Q3 2005). Forest Research Group.
- Munn, Ian A., and Anwar Hussain. “Hunting Leases: Markets and economic implications.” In Handbook of Forest Resource Economics, edited by Shashi Kant and Janaki R. R. Alavalapati. London: Routledge, 2014.
- Starr, Chris. Woodland Management: A Practical Guide. Crowood Press, 2005.
- Stern, Fritz. Gold and Iron: Bismarck, Bleichröder, and the Building of the German Empire. New York: Vintage, 1979.
- Wear, David N., and David H. Newman. “The Speculative Shadow over Timberland Values in the US South.” Journal of Forestry (December 2004).
- Zinkhan, F. C., W. R. Sizemore, G. H. Mason, and T. J. Ebner. Timberland Investments: A Portfolio Perspective. Portland, OR: Timber Press, 1992.
Important Information
This article is general information about timber as an asset class, written for educational purposes. It represents the author’s opinions as of the date of the most recent update. It is not a recommendation to buy or sell any security or to adopt any investment strategy, and it does not constitute personalized investment, tax, or legal advice. Bormann Wealth Management, LLC is a registered investment adviser in the State of Washington. No advisory relationship is formed until a written agreement is signed by both parties. Read the full Disclosures.
Hypothetical return estimates: The Bismarck Model and the figures derived from it, including the 4% real return estimate and its biological growth and land components, are hypothetical projections, not predictions or promises. They rest on assumptions about tree growth, land values, timber prices, and inflation that may not hold, and actual returns over any period, short or long, may differ significantly. The 1950–2020 stock market example illustrates how the model is built, and the 2026 stock market projection applies the same model to current yields; neither is evidence that any projection will prove accurate.
Data limitations: Historical figures in this article come from third-party sources believed to be reliable but not independently verified. The NCREIF Timberland Index is based on appraised rather than transaction values, its regional averages are affected by changes in the properties included, and its per-acre values include standing timber as well as land. Lumber prices are volatile, and compound growth rates calculated from them are sensitive to the start and end dates chosen. The Davies (1991) growth table describes individual trees, not whole forests or investment portfolios. Charts reproduced from company investor presentations reflect those companies’ own presentation of the data. The author is not affiliated with, and has not been compensated by, Weyerhaeuser, Rayonier, or NCREIF.
Unique risks of timberland: Investing in timber involves specific risks that differ from traditional stocks and bonds. These include biological risks (fire, insects, disease, and drought), market risks (fluctuations in lumber, log, and paper demand), and liquidity risks (physical timberland can take months or years to sell). Direct timber investments are often illiquid and may require high minimum capital. Revenue from carbon offsets and alternative land uses depends on evolving regulation, verification standards, and voluntary demand, and may not develop as described.
Timber REIT risks: Publicly traded timber REITs carry stock market risk and have historically been about as volatile as the broader market. Their results also depend on lumber and log prices, housing activity, interest rates, real estate development sales, and management decisions about harvests, acquisitions, and capital allocation. With only two U.S. timber REITs available, public-market timber exposure is concentrated in a small number of companies.
Tax considerations: Timber investments may be subject to unique tax treatment, including depletion allowances and capital gains treatment under Internal Revenue Code Section 631. REIT dividends may be taxed differently from qualified dividends on ordinary stocks. Bormann Wealth Management does not provide tax or legal advice; consult a tax professional about your specific situation.
Personal holdings: The author, Nick Bormann, personally owns shares of Rayonier (RYN) as of the most recent update, and may buy or sell shares at any time without notice. Bormann Wealth Management, LLC does not hold positions in any securities. Clients of Bormann Wealth Management may hold securities mentioned in this article. The author was not compensated for writing this article.