
Fundamentals
Skin in the Game, but Also in the Price
Insider buying is a classic 'tell' for management conviction and often treated as an indicator to buy. But does that signal still work?
When the CEO of a large payments company bought $1,000,040 of company stock in March of this year, what caught my eye was the number. Forty dollars over a million doesn’t happen by accident. Somebody aimed for a large, recognizable figure, and then rounded up a bit to be safe.
I was curious: are insider purchases sized to hit a headline number like $1 million different from other insider buys? Is the size a message?
Insider buying has a strong pull on investors. Peter Lynch’s well-known observation is that insiders sell for many reasons but buy for only one – they think the stock price is going up.1
More recently, on October 26 I attended Alex Edmans’ talk at LSE introducing his new book, The Madness of Markets: Why Smart Investors Make Crazy Decisions – And How to Exploit Them (2026). Part of his research is looking for behavioral “tells”, or signals from insiders that reveal their true thoughts about the state of the company, beyond the predictably upbeat public commentary. This line of research is alive and well, and for good intuitive reasons.
A CEO or director knows the business better than any outside analyst, and an open-market purchase is their own money, not a stock grant from the board. Prior academic research has backed this up, finding that insider purchases predict better stock returns, especially at smaller companies.2
On the other hand, an insider purchase becomes public almost immediately. Officers and directors have to file a Form 4 within two business days, those filings are free to read on the SEC’s website, and there’s no shortage of quantitative funds machine-scanning every one of them. Insiders can also simply be wrong. They might be overconfident about their own company, or alternatively, a large, visible purchase could be aimed to impress and signal conviction rather than indicating strong business prospects.
For years, noting insider purchases has been part of my due diligence process, so I had a practical reason to look, beyond just curiosity.
I set out with two questions. Are large round-number buys different from other buys? And more fundamentally, in recent data, does an insider purchase tell an outside investor anything the market hasn’t already priced?
I stuck to recent data: every open-market purchase filed from January 2020 through September 2026. A longer history would give more observations, but we know investor behavior adapts. Once a pattern is published and turned into a strategy, it tends to get traded away, so a finding that only shows up when the 1990s are added back in doesn’t help an investor today. A recent sample asks the more useful question, which is whether any factor we can spot now still works.
Here’s what I found.
The Paper Trail
The SEC publishes every Form 3, 4 and 5 in structured form, quarterly, as its Insider Transactions Data Sets. That’s the raw material here: who bought, how many shares, at what price, on what date, and how much they owned afterward. I downloaded the SEC files and the price histories, and then used Claude as a research assistant to assemble the dataset, run the statistical tests and draw the charts.
A few terms defined:
- An insider is an officer, a director, or anyone owning more than 10% of a class of the company’s stock. All of them have to report their trades.
- An open-market purchase is a buy on the exchange at market prices, with the insider’s own money (transaction code “P” on the form). This leaves out option exercises and stock awards.
- Excess return is the stock’s return minus an index’s return over the same period. A positive number means the stock beat the index.
- The filing reaction is the stock’s excess return from the close the day before the Form 4 was filed to the close the day after.
There were 96,729 Form 4 filings reporting open-market purchases over the period. I kept those by officers and directors, dropped stocks under $2 and a few unusual derivative arrangements (equity swaps), and removed 286 filings that looked like data-entry errors, such as a price off by a factor of ten from the company’s usual. That leaves 66,343 purchase filings by 20,153 insiders at 5,311 companies, worth $51.9 billion in total.
For prices I used Yahoo Finance. Each filing was matched to its stock by checking the reported purchase price against that day’s closing price. That worked for 38,013 filings at 2,575 companies, about 57% of the sample. Most of the rest are companies that have since been delisted, acquired or renamed, which the data covers poorly.
As a benchmark I used both the S&P 500 and the Russell 2000 (through the SPY and IWM index funds), but leaned more on the Russell 2000. Insiders mostly buy smaller companies: the median purchase price was $15.43 a share, and a third of purchases were in stocks under $10. Over the sample period the S&P 500 returned about 158% including dividends, and the Russell 2000 about 82%. Comparing insiders’ picks to the S&P would mostly measure that gap between large and small companies, not anything about insiders.
Many Small Buys, a Few Very Large Ones
To get a first impression, I looked at what typical insider buying looks like before running tests. Most purchases are relatively modest. The median filing was about $37,000, a quarter were under $9,000, and only one in ten topped $550,000. The raw dollars, on the other hand, are concentrated: the largest 1% of filings account for 58% of all the money spent.
Most purchases add to an existing stake: 88% of filings added to shares the insider already held on that ownership line, and the median purchase added 4.6% to the holding.
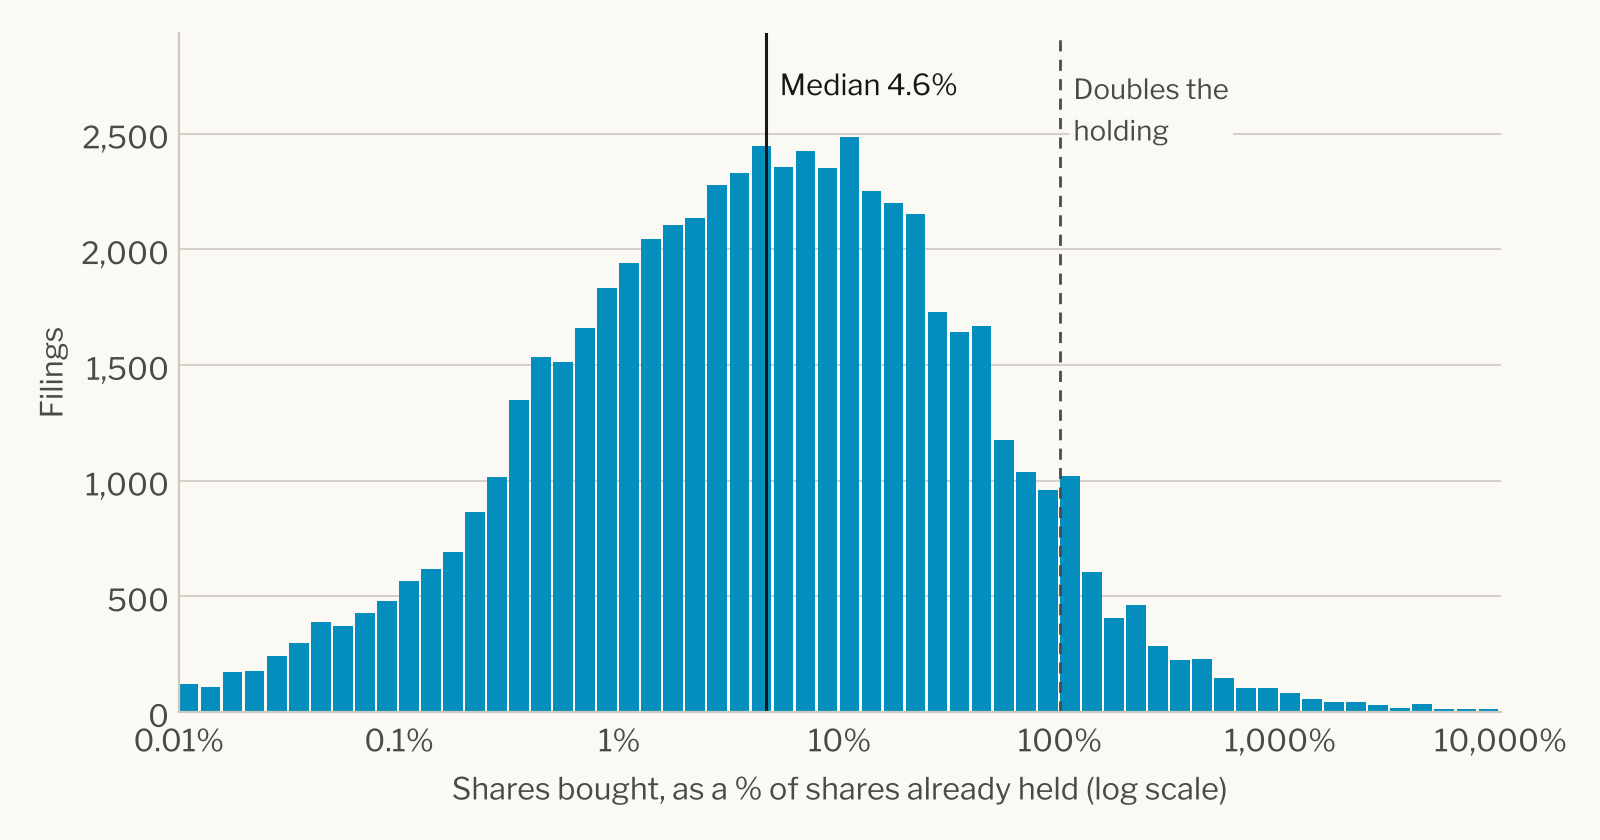
Directors without an executive role file about half of all purchases, and CEOs about a fifth. Directors who own 10% or more of the company file fewer than 5% of purchases but account for about a third of the dollars, which is part of why they get their own section below.
Insiders also tend to buy after prices fall. The median director bought after the stock had lagged the S&P 500 by about 3.5% over the prior month, and for CEOs the gap was about 5%. Purchases come in waves when the whole market drops: there were 4,010 filings in March 2020 alone, against an average of 819 a month. That fits the older research, which found insiders to generally be contrarian investors.2
The filings come out fast: the median Form 4 was filed one day after the last trade, and 70% within two days. By the time an investor reads about a purchase the market has had the information for a day or two, which turns out to matter a great deal for everything that follows.
Aiming for a Million
My first idea was inspired by the $1,000,040 purchase mentioned above. That CEO’s company stock had recently declined. Was her large purchase a way to “splash the pot”, and noisily signal her conviction that the headwinds were only temporary? Purchasing over $1 million of shares might register differently than some smaller odd number.
The first step was to check whether insider buys generally cluster at round amounts, and they do, heavily.
There were about 20 times as many filings within half a percent of $1 million as you’d expect from how many buys land a little further away (5% to 20% above or below). The same happens at other round amounts: about 13 times at $100,000, 7 times at $250,000, 14 times at $500,000, and 11 to 12 times at $2 million and $5 million. In all, 3,036 purchases (4.6%) landed within half a percent of one of those six figures.
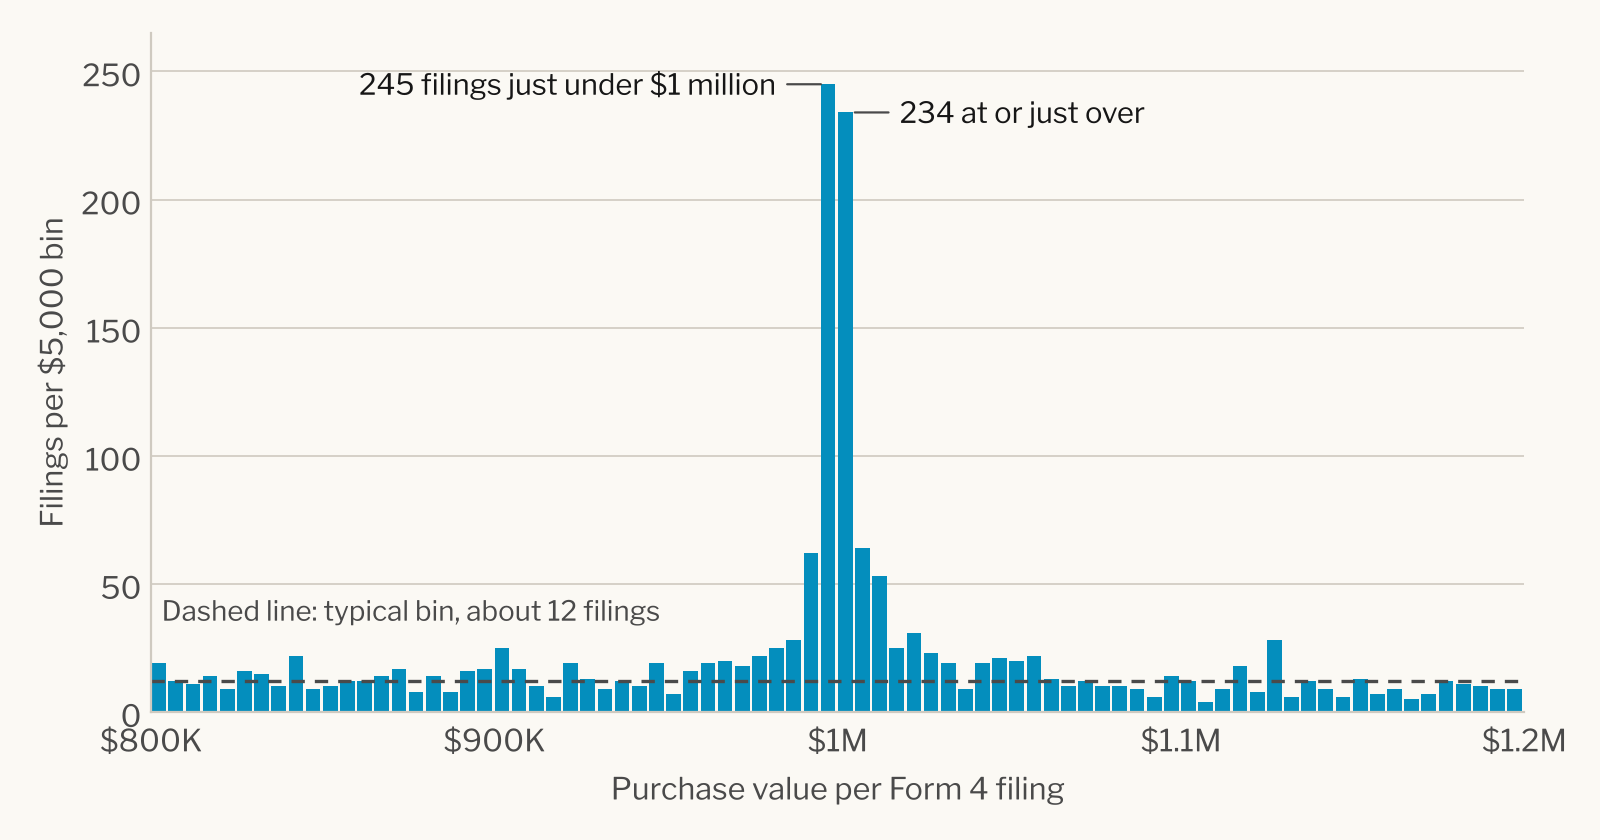
But there was no obvious step-change at the line. 245 purchases landed just under $1 million and 234 at or just over it, so insiders don’t seem to be trying to clear a threshold, just aiming at a familiar, large number.
Instead, I compared round-number buys with similar-sized buys that weren’t round (between 0.5% and 20% away from one of the six amounts above). If a big round purchase is an attempt to signal confidence at a company that badly needs it, could large round-number buys be a contrary signal for future performance?
At first glance, round buys did a little worse. Their return over the next 12 months, net of the Russell 2000, was 1.1 percentage points lower. But the result is statistically weak, as a gap that size would turn up about half the time by chance alone (p = 0.52). The market’s reaction on filing day was also the same for both groups, a median of about 1.2% versus 1.3%. Larger round buys, of $500,000 or more, trailed by 4.3 points, which is still within noise (p = 0.27).
Takeaway: a large round number buy looks like a mental shortcut. A $1,000,040 purchase most likely reflects an insider who decided to buy about a million dollars’ worth and rounded to whole shares. It doesn’t carry information an investor can use.
Directors Who Own a Tenth of the Company
Another group that interested me was directors who also own 10% or more of the company. A director who keeps adding to a large stake has a lot of skin in the game. And since directors are usually paid much less than CEOs, the stake is a bigger commitment relative to what the company pays them in salary. I wanted to see whether this group’s purchases stood apart.
The group needed some sorting first. Many “director plus 10% owner” filings are really investment funds, filed jointly with the partner who sits on the board, so I separated individuals from funds and their affiliates. That left 360 individuals with no executive role, at 353 companies, who bought in the open market. They’re a mix of investors who took a board seat, founders who stepped back from management, and founding families. About a third are at biotech companies, 72% never sold a share during the period, and the median individual bought about $5 million worth in total.
Their purchases did no better than ordinary directors’. Over the following 12 months, net of the Russell 2000, they came out 2.4 percentage points ahead, with a margin of error (one standard error) of 4.4 points, so effectively no difference. Insiders who had been accumulating steadily, buying in at least two earlier quarters without selling, did no better than first-time buyers either.
One group did stand out: 10% owners who aren’t on the board, mostly representing investment funds. Their purchases trailed ordinary directors’ by 7.0 points over 12 months, a gap unlikely to be chance (p = 0.01). But the same stocks did about as badly the following year too: a difference of +0.1 points, with a 95% range of -7.4 to +7.7. That points to the type of stock these funds buy, not the timing of the purchase.
Does Insider Buying Predict… Anything?
Setting aside round numbers and large owners, the more basic question is whether insider buying in 2020-26 told an outside investor anything at all. We can test this by running a hypothetical, backtested trading strategy.
The simplest version of the strategy holds, each month, equal amounts of every stock with an insider purchase filed in the prior 12 months. That’s about 1,170 stocks in an average month. This portfolio beat the Russell 2000 by 0.25% a month, roughly 3% a year, though not by enough to rule out luck (a t-statistic of 1.7, short of the usual 2). Against the S&P 500 it was flat.
That looks like a modest edge. But here’s what that comparison hides: insiders tend to buy a particular kind of stock. The median purchase was in a $15 stock trading about 22% below its 52-week high, after lagging the Russell 2000 by 12 points over the prior year, and a fifth of all filings were at banks, mostly small community banks.
The backtest can’t tell whether its excess return comes from owning that kind of company or from the timing of the insider’s purchase. If it’s the former, an investor could get the same exposure with a simple screen, no insider filings needed (and the slim, statistically shaky margin over small caps doesn’t make a strong case for doing that either). To separate the two stories, I compared each stock with itself. If insiders’ timing is informative, the year after a purchase should beat the year after that, for the same stock.
| Comparison | Observations | Difference (points) | 95% range |
|---|---|---|---|
| All purchases: year after filing vs. following year | 29,899 filings | -0.3 | -2.8 to +2.2 |
| Directors only | 14,431 filings | -1.6 | -3.8 to +0.5 |
| CEOs | 3,926 filings | +5.2 | -1.0 to +11.5 |
| Months followed by a purchase vs. other months, same stocks | 165,577 stock-months | -0.4 | -1.4 to +0.7 |
12-month returns net of the Russell 2000 (IWM). The year-over-year comparison covers filings through late 2024, since it needs two years of prices afterward. The last row accounts for each stock’s own average and each month’s market. Source: SEC Insider Transactions Data Sets (Form 4, 2020 Q1-2026 Q3); prices from Yahoo Finance; calculations mine.
Across all purchases, the year after an insider buy was no better than the year following. The last row asks the question from the other direction. At the same companies, months followed by an insider purchase did no better over the next 12 months than months without one. Leaving out the February-June 2020 crash, when buying spiked, doesn’t change the answer (+0.3 points, range -0.8 to +1.3).
The one group I can’t rule out is CEOs, whose purchases beat the following year by 5.2 points. The range runs from -1.0 to +11.5, so the data can’t strongly tell whether that’s real. Another check fails to back it up: the 12 months following a CEO buy were no better than 12-month stretches starting at other times for the same stock (-0.8 points, range -2.8 to +1.3).
This is where recent data parts company with the classic research. Lakonishok and Lee, covering 1975-95, found that insider buying did predict returns, mainly through purchases at smaller companies, while the market barely moved when insiders traded or reported their trades.2 Measured from the day of the trade, insiders’ own purchases over 1975-96 earned abnormal returns of more than 6% a year.3 A later study separated “routine” insiders, who trade around the same time every year, from “opportunistic” ones, and found that over 1986-2007 a portfolio of opportunistic trades alone earned value-weighted abnormal returns of 82 basis points a month.4
The contrast with Lakonishok and Lee is the telling one. In their data the market barely moved when insiders reported. In ours, the median stock gained 0.9% against the Russell 2000 over the two days around the filing, and 62% of stocks rose. Whatever information a purchase carries seems to be priced as soon as it’s public, and an outside investor only learns of a purchase when it’s filed. After that, I can’t find any extra left over returns.
To me, that’s an interesting non-result. It cuts against the core of a well-established literature, but it’s also what you’d expect once a strategy is widely known. Short-term effects get traded away first, and insider filings are about as public and machine-readable as information gets.
Squeezing the Data
Having found nothing with the obvious questions, I tried the opposite approach: unstructured data mining. The goal wasn’t an investment thesis. I was curious whether any statistically reliable pattern could be found at all, even one with no theory behind it.
Giving this task to Claude, we described each purchase in 92 ways. Some are relatively obvious:
- the insider’s role and title;
- the size of the buy, and how much it added to their holdings;
- whether it was their first purchase at the company or their fifth;
- whether other insiders were buying at the same time;
- the company’s industry;
- how the stock had been trading (volatility, recent returns, distance from its 52-week high).
Others were thrown in precisely because they shouldn’t matter: whether the insider has “MD” or “PhD” after their name, whether the price ended in 99 cents, which day of the week the trade happened, and which state the insider’s address is in. We tested each descriptor alone and in pairs against four outcomes: the filing reaction, and returns over the next 3, 6 and 12 months. That’s 4,300 tests.
Running that many tests guarantees false positives. With 1,075 tests per outcome, about 54 would pass a conventional 5% significance test by luck alone. So two safeguards were added. The first is a false discovery rate correction, which raises the bar for each test to account for how many were run. The second is a holdout. Patterns were found in 2020-22 (17,077 filings) and then had to show up again, with the same sign, in 2023-26 (20,936 filings), data the search never saw.
| Outcome | Tests | Passed in 2020-22 | Held up in 2023-26 | Correlation across periods |
|---|---|---|---|---|
| Filing reaction (2 days) | 1,075 | 282 | 234 (83%) | 0.86 |
| 3-month return | 1,075 | 96 | 10 (10%) | 0.09 |
| 6-month return | 1,075 | 59 | 6 (10%) | 0.13 |
| 12-month return | 1,075 | 89 | 13 (15%) | -0.01 |
Returns are net of the Russell 2000 and compared within each filing month. Held up means the same sign and a p-value below 0.05 in 2023-26. The correlation is between each test’s t-statistic in the two periods. Source: SEC Insider Transactions Data Sets; prices from Yahoo Finance; calculations mine.
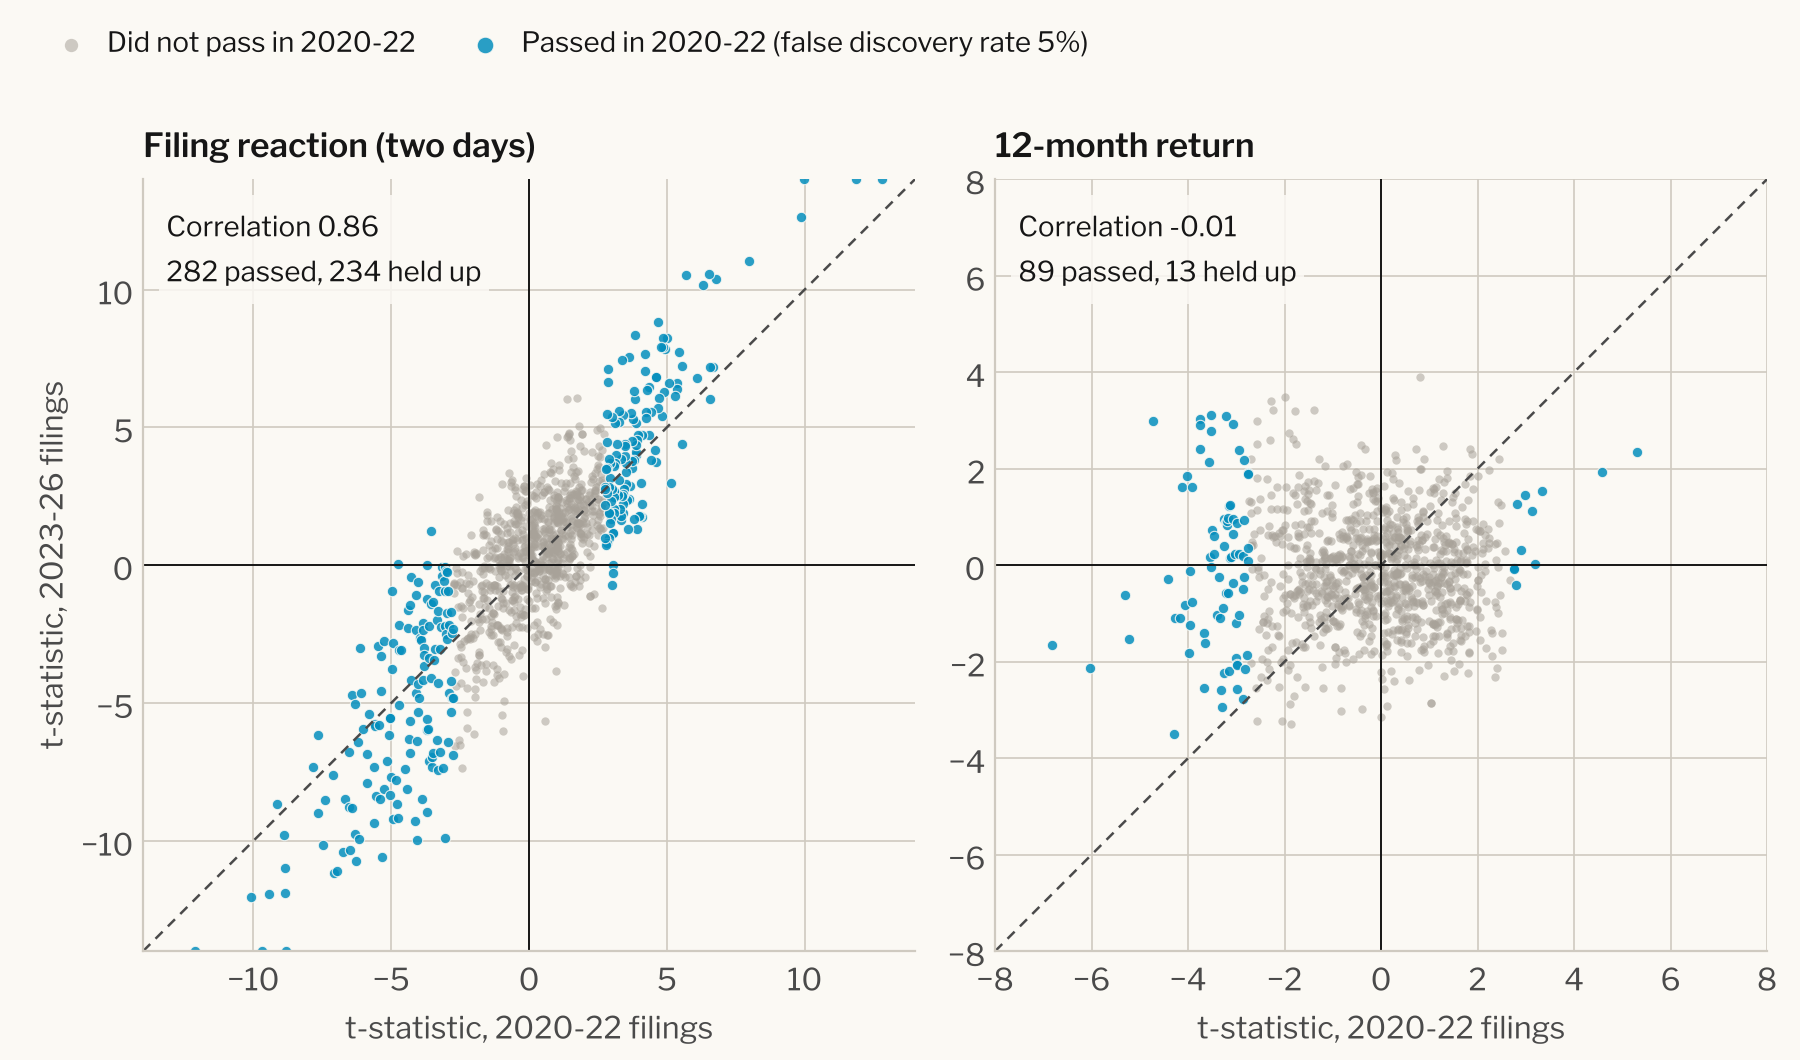
The filing reaction replicates almost perfectly. The market pays up when:
- the buyer is a first-timer;
- the purchase is large, or a big addition to the insider’s holdings;
- the stock is volatile or well below its 52-week high;
- the company is in biotech.
It discounts purchases by repeat buyers, and purchases at banks and closed-end funds. Most of the difference shows up between the close on filing day and the next day’s close, consistent with many filings landing after the market closes. In other words, the market reads these filings the way an experienced investor would, and it does so in about a day.
Longer-term returns are another story. A handful of patterns held up, more than chance alone would produce, but they were about the kind of company rather than the purchase: SPAC-like shell companies, closed-end funds, insiders with foreign addresses. Compared against the same stocks in months without insider buying, they disappeared. A machine-learning model given all 92 descriptors told the same story: its out-of-sample predictions sorted stocks by type, not by anything about the insider.
The point: whatever information an insider purchase contains is priced within about a day of the filing. After that, I couldn’t find a pattern that survived both a fresh sample and a comparison against the same stocks.
Where Things Stand
For my own process, the conclusion is practical. We know insider buying has a strong emotional draw, supported both by basic intuition and some dated finance studies, but applying that to current-day markets might be costing us objectivity for no benefit. The trading reaction happens in a flash, so a due diligence process that takes days or weeks can’t make use of the insider signal.
The one loose end is CEO purchases. One comparison suggests the year after a CEO buy beats the year after that by about 5 points, but another way of measuring the same thing shows no advantage. A real edge should show up across multiple methods of measurement. And as with the broader backtest, any return from following insiders is hard to separate from the kind of company they buy: mostly small, beaten-down stocks, a fifth of them banks. Applied widely, a follow-the-CEO strategy resembles a small-cap value screen with the extra step of pulling SEC Form 4s.
If a company already has other attractive traits and I also see the CEO buying, I’d treat that as neutral to mildly positive. But the information is likely already in the stock price, so CEO buying shouldn’t decide whether or not to invest. In its place, my process now records how large each executive’s equity stake is relative to their pay – a topic for another time.
Contrary to earlier papers, there is no statistically significant lingering effect of insider buying, so we shouldn’t treat it as a signal in long-term investing strategies. It’s an unreliable “tell”.
Important Information
This article is general research on insider trading data, written for educational purposes. It represents the author’s opinions as of the date of publication. It is not a recommendation to buy or sell any security or to adopt any investment strategy, and it does not constitute personalized investment, tax, or legal advice. Bormann Wealth Management, LLC is a registered investment adviser in the State of Washington. No advisory relationship is formed until a written agreement is signed by both parties. Read the full Disclosures.
Data and method: SEC Insider Transactions Data Sets, 2020 Q1 through 2026 Q3: open-market purchases (code P) reported on Form 4 by officers and directors, with 10% owners included in the large-owner section. Stocks under $2, equity swaps and 286 likely data-entry errors were removed. Prices are from Yahoo Finance. Returns are measured against the SPY (S&P 500) and IWM (Russell 2000) exchange-traded funds, including dividends. Analysis assisted by Claude Opus 5.5.
Hypothetical results: The portfolio and comparison returns in this article are hypothetical, calculated from historical data. They don’t reflect actual trading, transaction costs, taxes or fees, and neither the patterns found nor their absence is a guarantee of future results.
Limitations: The sample period is short by design and includes an unusual episode, the 2020 crash and rebound, so the results describe 2020-26, not insider buying in general. Only 57% of purchase filings could be matched to price history; companies that were later delisted, acquired or renamed are under-represented, and failed companies are the most likely to be missing. Returns are compared against two index funds rather than a full risk-factor model, and mostly weight each purchase equally, so smaller companies dominate. Filings are as submitted by insiders and may contain errors the cleaning didn’t catch.
Peter Lynch with John Rothchild, One Up on Wall Street (Simon & Schuster, 1989). ↩︎
Josef Lakonishok and Inmoo Lee, “Are Insider Trades Informative?”, Review of Financial Studies 14, no. 1 (2001): 79–111. ↩︎ ↩︎ ↩︎
Leslie A. Jeng, Andrew Metrick and Richard Zeckhauser, “Estimating the Returns to Insider Trading: A Performance-Evaluation Perspective”, Review of Economics and Statistics 85, no. 2 (2003): 453–471. ↩︎
Lauren Cohen, Christopher Malloy and Lukasz Pomorski, “Decoding Inside Information”, Journal of Finance 67, no. 3 (2012): 1009–1043. ↩︎