Sector Research
Noisy Tollbooths: Gold Royalty and Streaming Companies
Royalty companies are often pitched as the smarter way to own gold: no mines to operate, just a cut of the output. But do they compound value, or just ride the gold price?
Precious metals exposure is a dilemma for portfolio construction. On the one hand, inflation is the modern reality and we want to hedge against the rising cost of living, and gold is historically one way to do that. On the other hand, gold bars are shiny rocks that just sit there, paying no interest or dividends.
Gold’s inertness is supposedly a feature, not a bug, but that still makes it a troubling long-term holding when seeking growth and not just capital preservation. Instead, what about owning operating businesses within the gold industry? Can we gain gold’s useful diversification features within a profitable equity shell?
Gold miners are one representation of that theme, but the economics of mining is uncertain, capital intensive, and historically troublesome for investors.1
Royalty and streaming companies take a different approach: rather than digging the hole, they help pay for it. A miner building or expanding a mine takes cash upfront from a royalty company, and in exchange gives up a slice of future revenue, or the right to buy a share of its metal at a low fixed price, while retaining all of the operating costs and the risk of overruns. It’s a form of financing for an industry that struggles to borrow, and for investors it promises gold’s upside with less of the headache that make mining so troublesome.
Are gold royalty stocks the superior way to gain precious metal exposure in a portfolio? Unfortunately there is no free lunch, and this supposedly cleaner business model carries its own difficulties as well. Let’s dig deeper into the economics of gold royalty and streaming companies.
Five Companies, One Bet
I ran five of the largest listed gold royalty and streaming companies through my due diligence process, using company filings through the third quarter of 2026. A few terms come up throughout, so here they are up front:
- Royalty: a percentage of a mine’s revenue, paid to the royalty holder for the life of the mine, with no further payments required.
- Stream: an upfront payment (the “deposit”) that buys the right to purchase a fixed share of a mine’s metal at a low ongoing price, often 10-20% of the spot price. Streams are usually written on by-product metal, such as gold or silver coming out of a copper mine.
- GEO: gold equivalent ounces, the industry’s way of adding gold, silver and other metals together into one production figure.
- ROIC: return on invested capital, the profit a company earns on the money it has put into the business.
| Company | Approx. market value | Main exposure | Model |
|---|---|---|---|
| Wheaton Precious Metals (WPM) | $70B | Silver, gold | Streams |
| Franco-Nevada (FNV) | $35B | Gold, copper, oil and gas | Mostly royalties, some streams |
| Royal Gold (RGLD) | $20B | Gold, copper | Streams and royalties |
| Triple Flag (TFPM) | $7B | Gold, silver | Streams and royalties |
| OR Royalties (OR), formerly Osisko | $7B | Gold | Mostly royalties |
Market values as of September-October 2026, rounded. Source: company filings.
The appeal of the business model is easy to see. The mine operator pays for the labor, the fuel, the equipment and every cost overrun, while the royalty holder collects a slice of revenue off the top. These companies can run with very small staffs (OR Royalties had 23 employees at the end of 2025), and their margins are very high: OR Royalties reported a 96.7% cash margin for 2025, and Triple Flag a 93% asset margin in 2026.
At first glance, the numbers are excellent. Return on invested capital over the trailing twelve months ran from 11.5% to 19.4% across the five. However, those same companies earned far lower ROIC before the gold price took off in 2024.
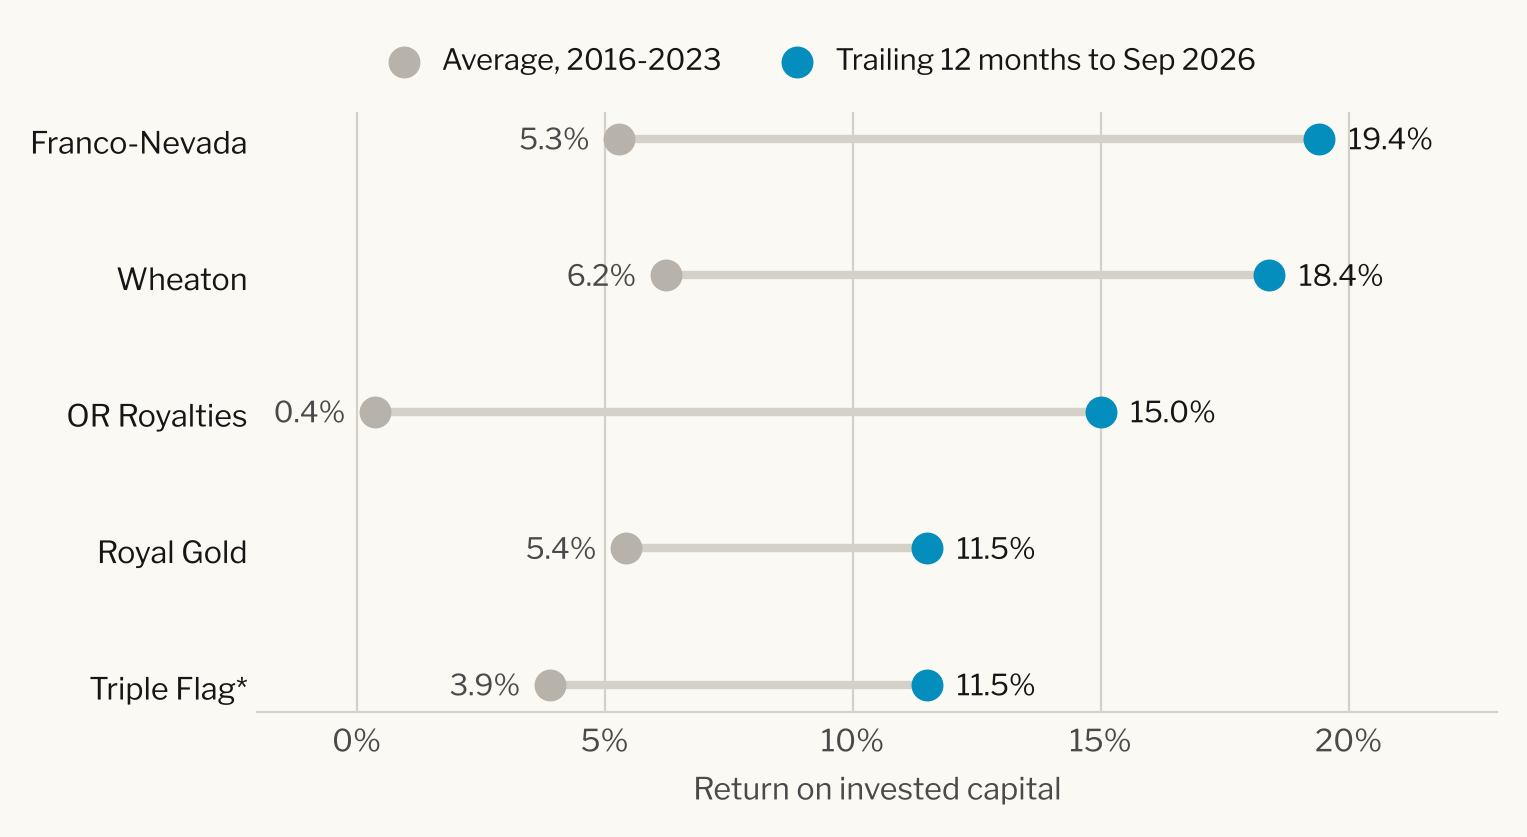
The mining operator carries the costs, so a royalty company’s expenses barely move when the gold price does, and nearly all of a higher price falls straight through to profit. That makes these businesses look like they’ve become better at what they do, even if the volume of metal they collect hasn’t grown much at all.
Two examples: Franco-Nevada’s revenue rose 49.5% from 2023 to 2025 while the GEOs it sold fell 17.2%. At OR Royalties, GEOs fell 14.4% over the same period while revenue per GEO rose from $1,943 to $3,434. Returns on capital went up due to commodity pricing, not volume, so operational skill is hard to unpack.
When I looked at each of the companies separately, all five came back with the same answer: returns had improved recently because of the gold price, not because the economics of the business changed. A stock selection process is supposed to separate strong operators from weak ones, but here the gold price swamped almost everything else I measured.
The Curse of the Winning Bid?
These companies have a favorable business model, so why is it so hard for them to earn decent returns on capital over a full cycle? One explanation comes from an old problem in resource auctions, the “winner’s curse.”
The idea was first written up in 1971 by three engineers at Atlantic Richfield, who were trying to understand why oil companies had earned such poor returns on federal offshore leases in the Gulf of Mexico.2 Their answer was that when many companies bid on a tract whose true value nobody knows, the winner tends to be the bidder whose estimate was too high.
The winner’s curse shows up when three conditions hold at once:
- The prize is worth about the same to every bidder. An ounce of gold is worth the same to Franco-Nevada as it is to Wheaton, so the cash flows from a stream don’t depend on who owns it.
- Everyone’s estimate of value is noisy. The biggest inputs to a stream’s value are how long the mine will run, how quickly it ramps up, and whether the operator stays solvent. Reasonable bidders can disagree widely on each of these.
- Several bidders have similar capital. The large royalty companies, private credit funds and, more recently, newer entrants with very different economics are all competing for the same deals.3
The streaming business meets all three conditions. These companies bid for the same mines, often share interest in the same projects, and the underlying value in a gold mine is notoriously difficult to forecast.4
That being said, the winner’s curse isn’t a natural law that implies bidders must overpay. The point of the 1971 paper was that a bidder who understands the problem can correct for it by bidding below its own estimate, and royalty companies are experienced, repeat bidders who know this risk well. Wheaton, for example, says it reviews more than 100 potential streams a year and typically completes about three.5
So what should we expect to see? In a market of disciplined bidders, the curse doesn’t produce systematic losses. Instead, it shows up as a ceiling on returns: a bidder who adjusts for it loses more auctions, and the deals that do get won are priced close to the buyer’s cost of capital. The evidence fits that reading. Average returns on invested capital over 2016-2023, before the gold rally, ran between about 4% and 6% for four of the five companies (OR Royalties, hobbled by large write-downs, averaged close to zero). That’s at or a little below the 6-7% return hurdle Wheaton has reportedly used.
There’s a second, related problem. The mine operator knows its orebody better than any outside buyer, and it decides which asset to sell, which metal to stream and when. The developers that need stream financing most are often the ones that can’t raise money elsewhere, which can tilt the pool of available deals toward weaker projects.6
Sellers also keep options against the royalty owner, and they tend to exercise them when a deal has turned out well.
| Company | Asset | Right held by the operator |
|---|---|---|
| Franco-Nevada | Côté (Ontario) | Buyback of 50% of the royalty at cost, exercised and closing December 2026 |
| Royal Gold | Great Bear (Ontario) | Buyback of 25% of the royalty |
| Royal Gold | Mount Milligan (B.C.) | Cost support from around 2030 that raises the effective gold cost from $435 to $850, then $1,050 per ounce |
| Triple Flag | Northparkes E44 (Australia) | Option to terminate minimum deliveries for $102.5 million |
| Triple Flag | Cerro Lindo (Peru) | Step-down in the stream rate from 65% to 25% |
| OR Royalties | Cascabel (Ecuador) | Buy-down of 50% of the gold stream and one-third of the royalty |
| Wheaton | Antamina (Peru) | Stream share drops to one-third after 100 million ounces |
Source: company filings and press releases through Q3 2026.
Looked at one company at a time, each of these reads like a concession from a particular negotiation. Across all five, they look more like the going price of access in a competitive market, which means a deal’s headline economics overstate its expected value for every buyer.
The result shows up in how long the money takes to come back. By the end of 2025, Salobo, one of Wheaton’s oldest and largest streams, bought in stages between 2013 and 2016, had returned 98.5% of its $3.57 billion deposit in cash. Royal Gold’s Pueblo Viejo stream, which started in July 2015, recovered its $610 million advance only in 2025. Both are good assets, and a payback of about a decade is what you would expect from deals priced in a competitive market.
So where could a royalty company earn excess returns? I found three potential causes, but each with a limit:
- A legacy portfolio bought cheaply decades ago. Franco-Nevada’s ground in Nevada and elsewhere can’t be rebuilt at historical cost. But that’s a fixed stock of value, already reflected in the share price, and it says nothing about the returns on new capital.
- Creating royalties before there’s an auction. Being in at the start, through exploration financing or company relationships, avoids competitive bidding. However, this likely doesn’t scale to billion-dollar deals.
- Having capital when nobody else does. In a downturn, miners can’t raise equity, competitors are stretched, and a buyer with cash gets paid for supplying scarce funding. The catch is that it requires sitting on cash through the boom, and losing deals to competitors in the meantime.
Each of these mechanisms requires either a pre-existing advantage or very strong capital discipline, withholding funds until the time is exactly right. There’s limited evidence of this discipline across the market.
Why the Deals Cluster at the Top
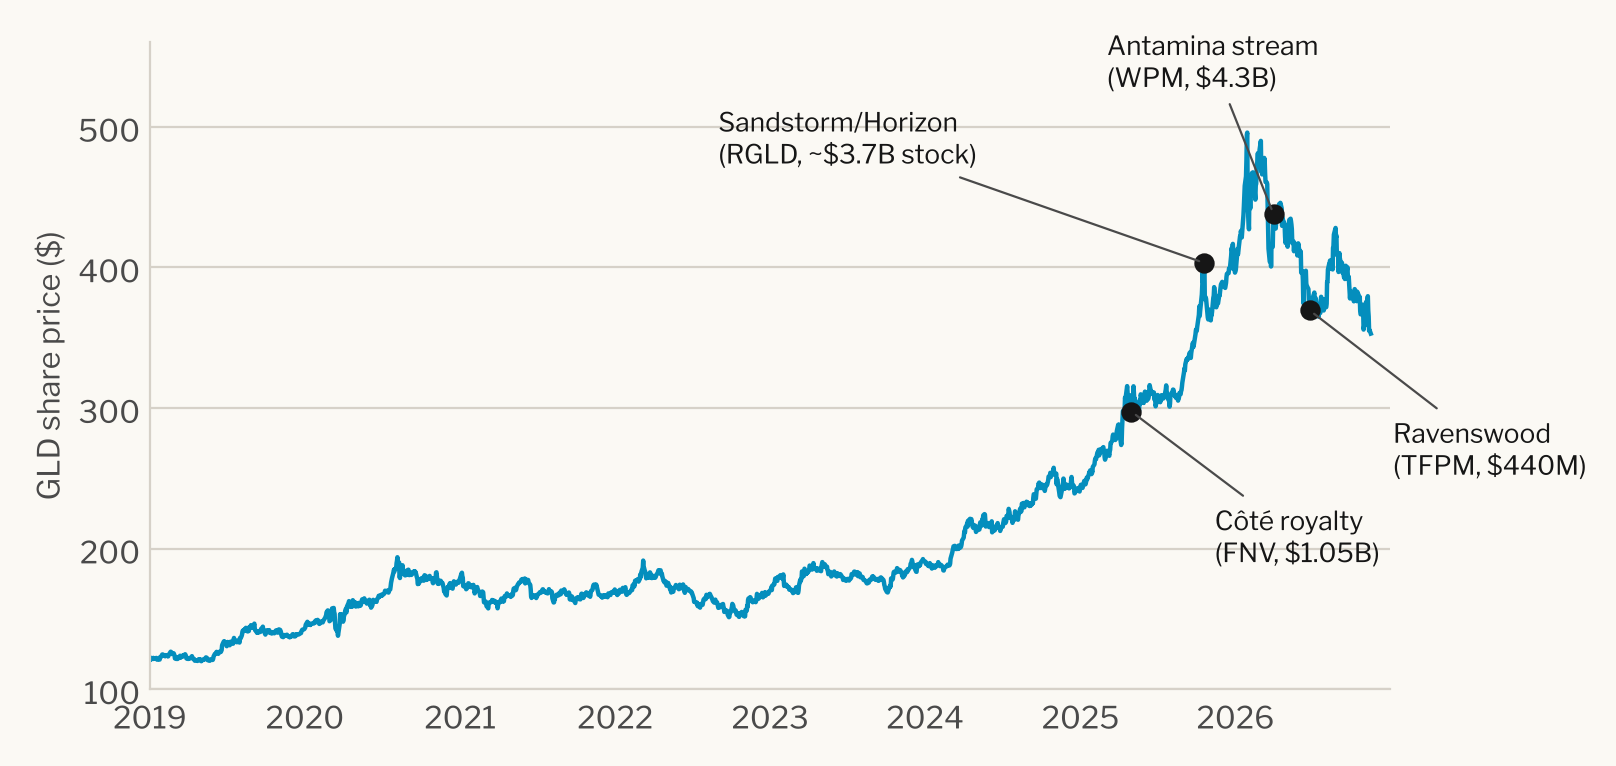
All five companies deployed heavily in 2025-26, near the peak in metal prices. Before reading too much into that, let’s be fair about why.
| Company | Deployed since Jan 2025 ($M) | Multiple of trailing operating cash flow | Main funding |
|---|---|---|---|
| Wheaton | 5,991 | 2.1x | Cash, plus $2.7 billion of bank debt |
| Franco-Nevada | 2,860 | 1.5x | Cash, no debt |
| Royal Gold | 5,337 | 4.4x | Stock (share count up 28.6%), plus debt that peaked at $1.225 billion and has since been repaid |
| Triple Flag | 691 | 1.7x | Credit facility, $185 million drawn |
| OR Royalties | 459 | 1.5x | Revolver, $228 million drawn |
Royal Gold includes about $3.7 billion of stock issued for Sandstorm Gold and Horizon Copper; its cash-only multiple is 1.4x. Operating cash flow is the twelve months to September 2026. Source: company filings; calculations mine.
Deal supply in the mining industry follows metal prices. High prices are when miners approve new projects and expansions, and when the large copper producers sell their by-product gold and silver to finance growth. A royalty company can only buy what’s for sale, so its deal flow naturally peaks when prices do. A company that refused to buy anything at high prices might watch its contracted ounces deplete away.
Even so, the timing matters for shareholders, because the price paid for a stream reflects the metal price expected when it was signed. Royal Gold’s five-year outlook, for example, uses $4,000 gold, close to where gold traded through much of 2025-26. Gold peaked in January 2026 and has since fallen about 29%, so the cohort of recent deals now earn less than they would have, if metal prices had stayed elevated. We’ll only know in hindsight if that $4,000 assumed price was the winner’s curse in action or not.
Given that deals arrive in the boom, what separates good capital allocation is less when a company buys than how: what metal price each deal is underwritten at, whether it’s paid for with cash or newly issued shares, and what it does to the ounces each shareholder indirectly owns.
The management incentive design doesn’t fence out many of these pitfalls. None of the five companies ties executive pay to return on capital, internal rate of return, or any specific return hurdle. Several reward volume directly: production ounces at Wheaton, gross GEOs and reserves at Royal Gold (half the annual bonus), GEOs earned at OR Royalties, and “deal origination” at Triple Flag. And at all five, a large part of performance pay is measured by total shareholder return relative to peer groups that include the other royalty companies.
Relative pay makes it less personally costly for a management team to move with the cycle than to lean against it. If everyone’s recent deals disappoint together, nobody underperforms their peers.7
Not Quite Golden
If these companies don’t compound value on new capital, the remaining case for holding them is as a way to own gold by proxy. So how well do they track it?
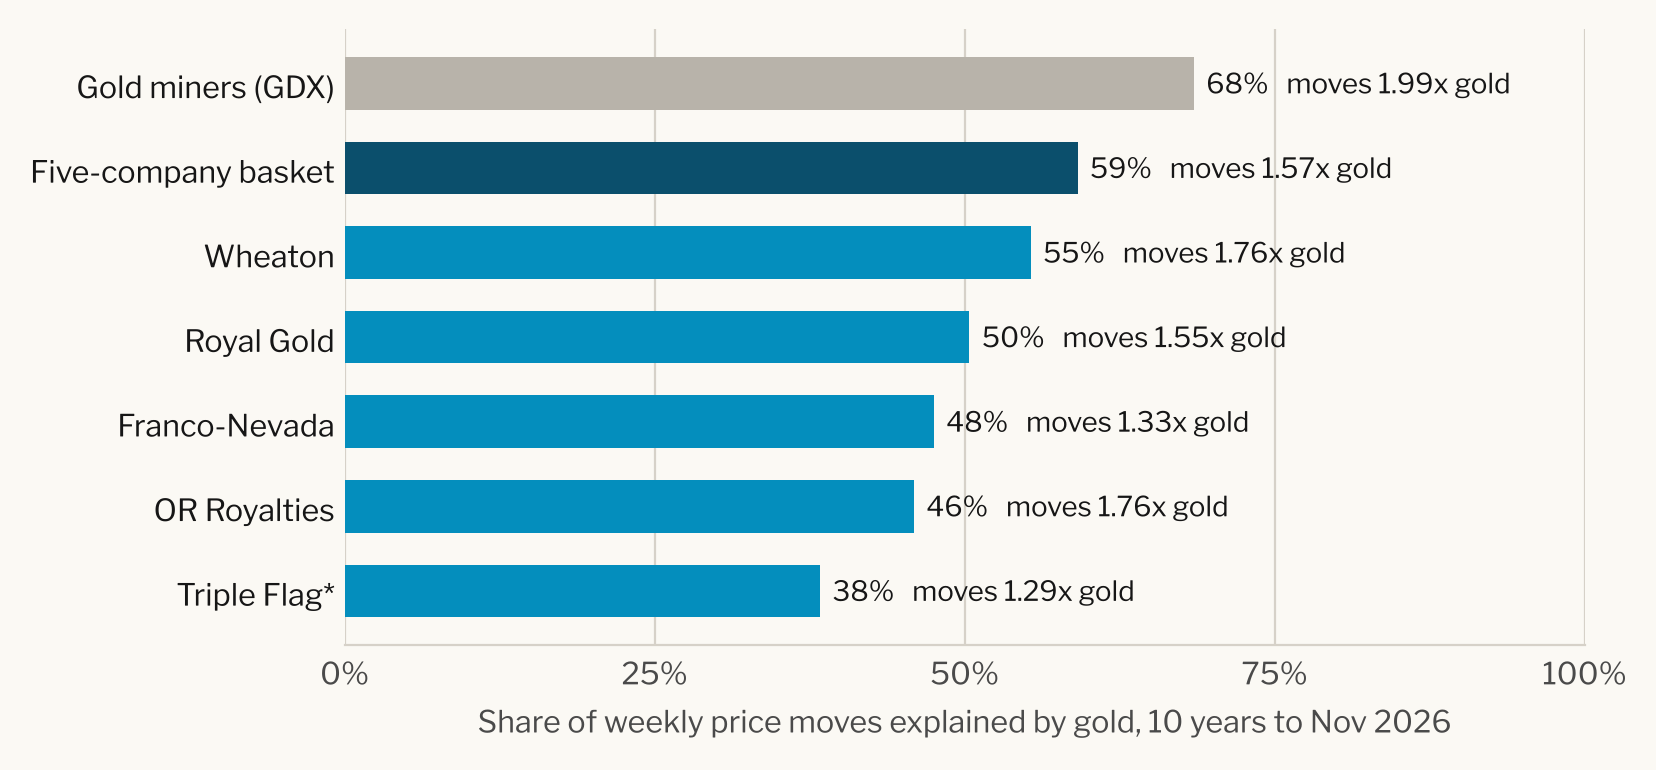
To test this, we pulled ten years of daily prices for the five companies, the SPDR Gold Shares ETF (GLD) as a stand-in for the gold price, the VanEck Gold Miners ETF (GDX) for comparison, and the S&P 500 (SPY). We then measured how closely weekly returns moved together.
| Ticker | Moves vs. gold | Share of price variation from gold | Share from other factors | Volatility | Return above gold-implied, 10 yrs | Return above gold-implied, 5 yrs |
|---|---|---|---|---|---|---|
| WPM | 1.76x | 55% | 45% | 36.4% | +0.7% | -3.4% |
| FNV | 1.33x | 48% | 52% | 29.7% | +0.4% | -7.7% |
| RGLD | 1.55x | 50% | 50% | 33.6% | -3.3% | -2.7% |
| TFPM* | 1.29x | 38% | 62% | 36.7% | -3.0% | -3.0% |
| OR | 1.76x | 46% | 54% | 40.0% | -6.2% | -3.5% |
| Five-company basket | 1.57x | 59% | 41% | 31.5% | -2.2% | -4.6% |
| GDX (gold miners) | 1.99x | 68% | 32% | 37.0% | -8.0% | -9.0% |
| GLD (gold) | 1.00x | 100% | 0% | 15.4% | n/a | n/a |
Weekly returns, ten years to November 16, 2026, annualized. The two shares of price variation add to 100%: the first is the portion of each stock’s weekly return variance explained by gold’s, the second is everything else. Return above gold-implied is each stock’s annual return beyond what a gold position scaled to its sensitivity would have earned, assuming the leverage cost nothing. *Triple Flag covers August 2022 onward only. Source: Yahoo Finance; calculations mine.
Three things stand out.
First, these stocks are a leveraged version of gold, not an exact substitute for it. Each one moves 1.3 to 1.8 times as much as gold, with volatility of 30-40% a year against about 15% for gold itself.
Second, gold explains only about half of their weekly moves, and the rest mostly isn’t the stock market or silver either. Adding the S&P 500 and silver explains only a few percentage points. What’s left behaves like a shared royalty-sector factor: after removing gold and the stock market, the five companies’ leftover moves still have an average correlation of 0.52 with each other. A basket of all five still gets about 40% of its price variation from sources that have nothing to do with gold. The gold miners ETF, for its part, tracks gold more tightly than any of the royalty companies.
Third, once you account for price leverage, the extra return is roughly zero over ten years for the two best performers, and negative for everyone else. That comparison assumes the implied leverage was free, which flatters gold a little, since borrowing to hold 1.5 times as much gold would cost money. But the broad finding holds: the returns these companies earned are what you’d expect from a leveraged bet on gold.
The price relationship also isn’t stable. The 52-week rolling correlation with gold ranged from about 0.36 to 0.89 for the four companies with full histories. It was weakest in 2018-19, when gold was quiet, and is near its high today. These stocks track gold most closely when gold moves the most, and drift off on their own when it doesn’t.
Did the 2026 Selloff Break the Pattern?
The most recent stretch is the one exception, and it’s worth a closer look.
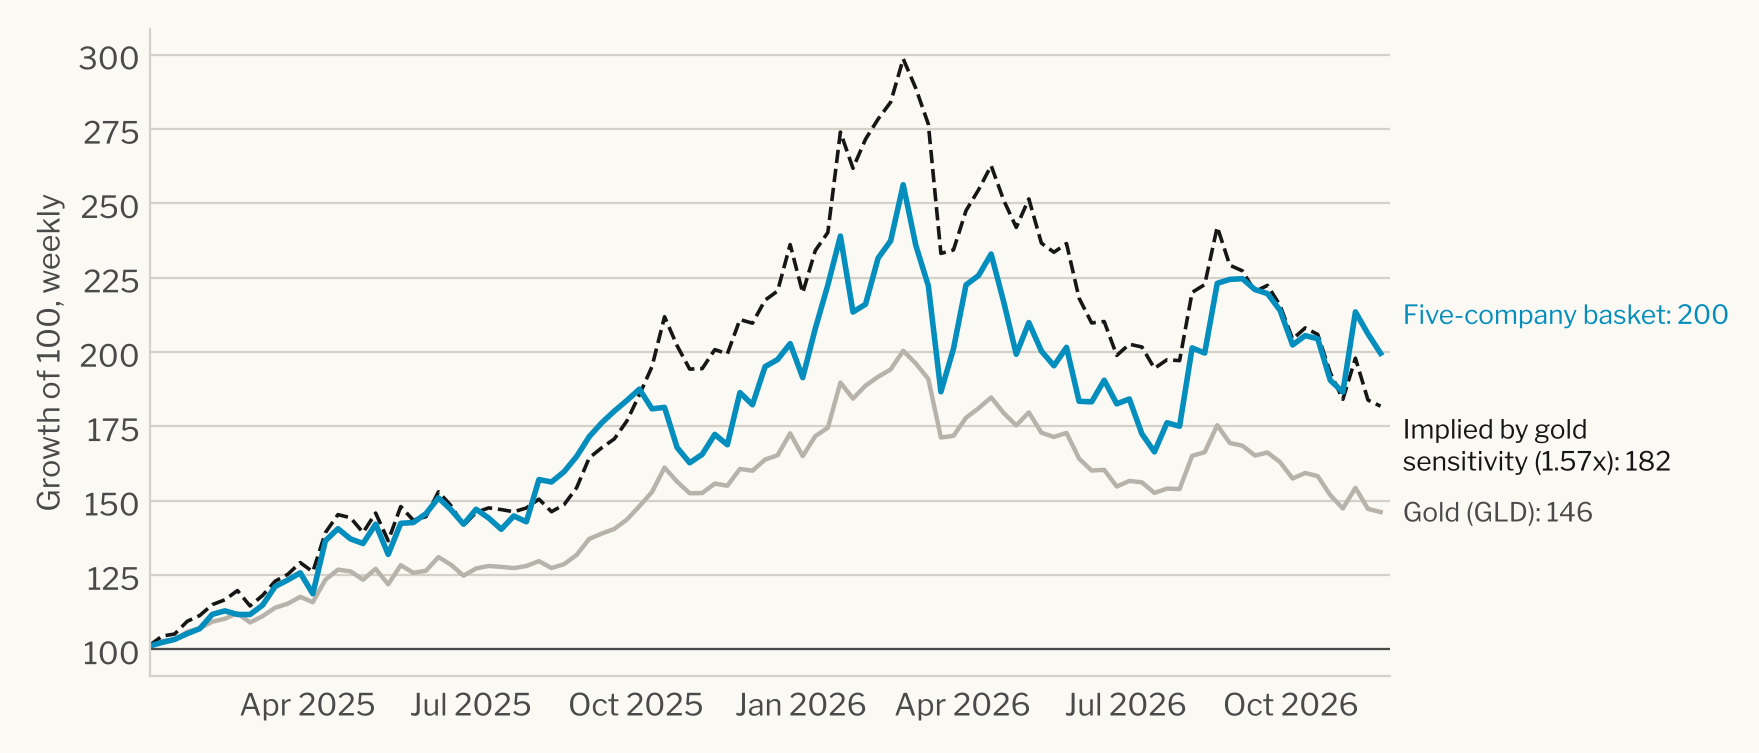
Through most of 2025, the basket tracked its gold-implied path closely. When gold spiked into early 2026, the stocks didn’t follow it all the way up: at the late-February weekly peak, the basket sat about 14% below where its gold sensitivity implied. Since then the stocks have fallen far less, 22% against an implied 39%, and the basket now sits about 10% above its gold-implied level.
Measured from gold’s peak, the gap looks large. In the roughly ten months since, Wheaton, Franco-Nevada, Royal Gold and OR Royalties have each run between 28% and 48% ahead of what their gold price sensitivity implied, a bigger gap than in almost any other period of that length since 2015. The gold miners ETF shows the same pattern, so it’s something about gold equities as a group rather than royalty companies in particular.
There are two ways to read this. The market may never have priced in the January spike, and may be valuing these companies on a long-run gold price closer to $4,000, rather than the spot price. Or the shares are awaiting a downward re-rating that hasn’t arrived yet. A gap like this can close from either side: the royalty stocks could fall toward the gold price, or gold might recover.
Do They Diversify a Stock Portfolio?
A common reason to own gold is as a “flight to safety” asset when stocks fall. To check whether that holds, I looked at every decline of 10% or more in the S&P 500 since 2015.
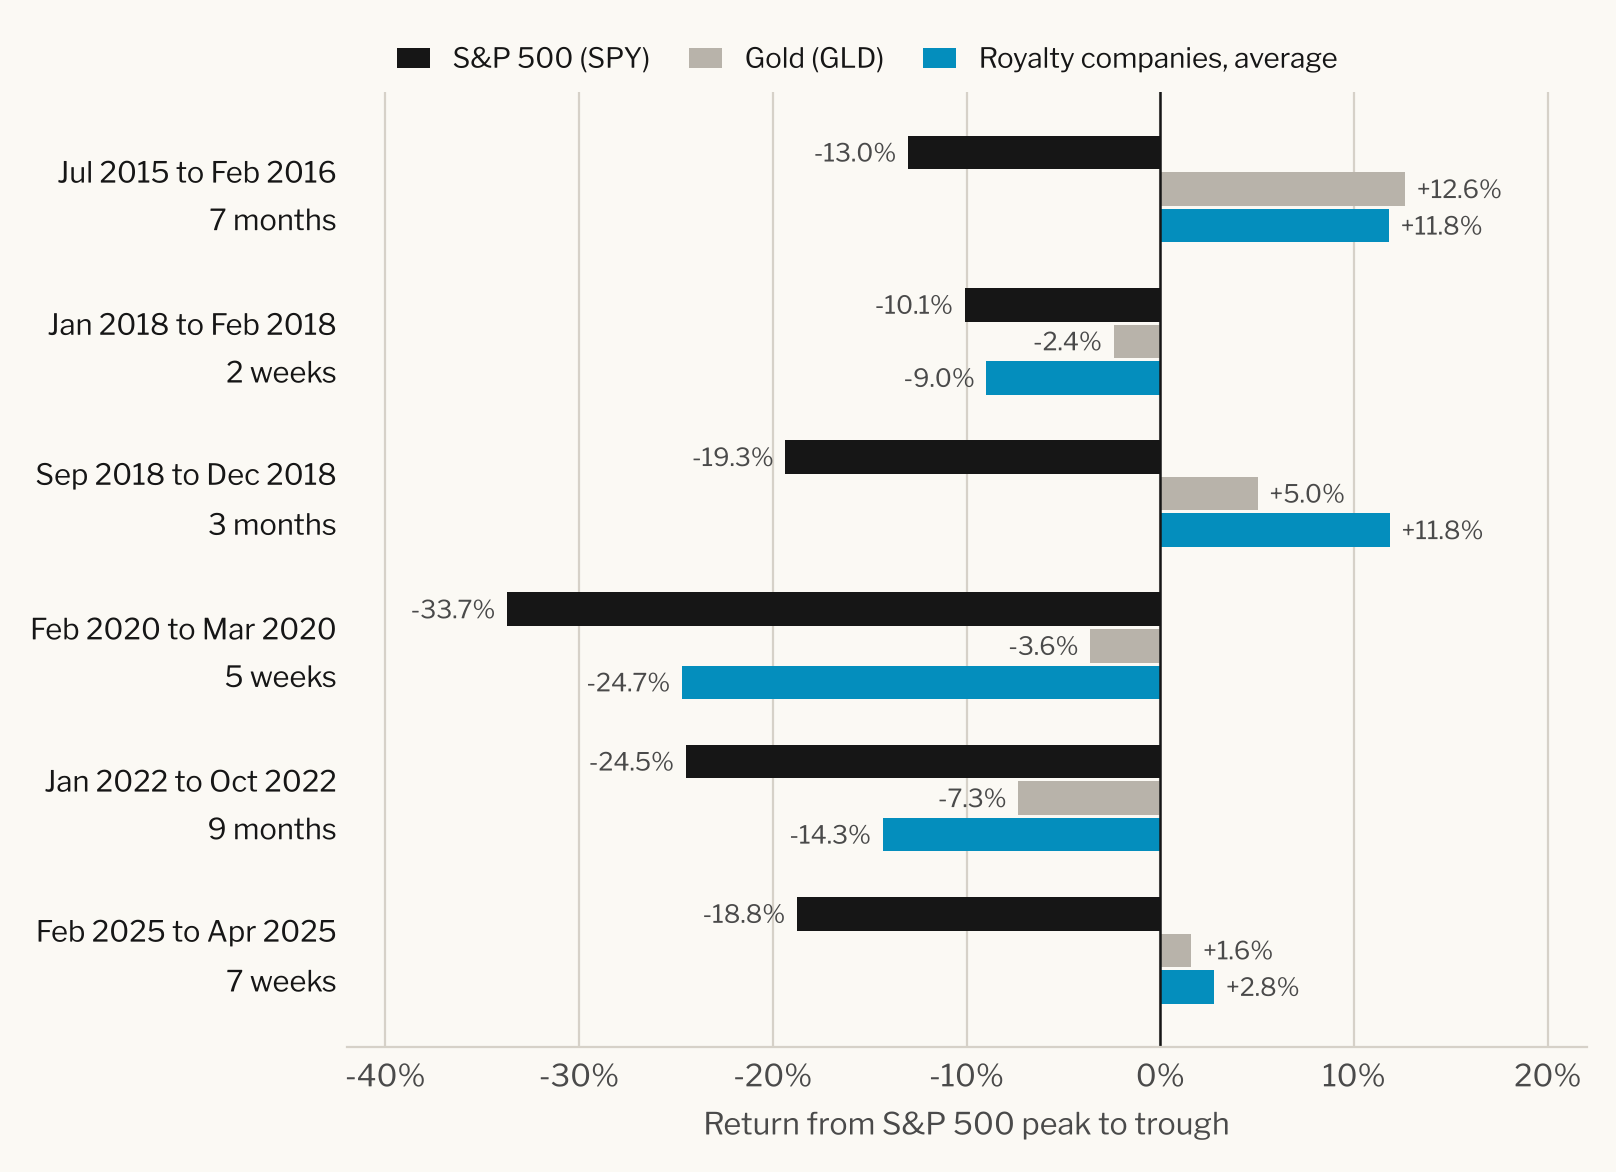
Gold itself still diversifies, though it doesn’t reliably hedge. Its weekly correlation with the S&P 500 over the whole period was 0.14, and in the S&P’s down weeks it moved only 0.17 times as much as stocks. It rose in three of the six declines and fell modestly in the other three, including the two largest: the 2020 pandemic crash and the 2022 rate shock. The relationship has also shifted. Gold’s correlation with stocks was negative in every year from 2015 to 2019 and positive in every year from 2020 to 2024, so it now behaves less like a hedge and more like a risk asset with low sensitivity to stocks.
The royalty companies are a different story. As a group, they had a 0.24 correlation with the S&P 500 and moved 0.61 times as much as stocks in down weeks. In March 2020, when investors needed a safe asset most, they fell an average of 24.7%, against 3.6% for gold. They carry most of the risk of owning stocks, plus a leveraged and noisy exposure to gold on top.
For an investor who wants gold for diversification, holding the metal (or a bullion ETF) does that job, and the royalty companies don’t.
Where Things Stand
So, are gold royalty stocks the superior way to own precious metals? Having worked through all five, I don’t think they are, though not necessarily because the businesses are bad. The toll-collecting model works: high margins, tiny staffs, and operating costs left to someone else. But the deals that feed it are sold in a competitive market, and the winner’s curse puts a ceiling on what new capital can earn. The excellent returns of the last two years mostly reflect the gold price, rather than a lasting improvement in the operating businesses.
As a way to hold gold, royalty stocks are a noisy proxy. Only about half of their price movement comes from gold, and the rest from a sector factor of their own. In the worst stock market selloffs, they’ve behaved more like stocks than like a safe haven.
That leaves a narrower case for ownership: as a deliberate, leveraged bet on the gold price, with the equity risk accepted as part of the bargain, or perhaps after a sector downturn, when capital is scarce and the deals on offer improve.
At this exact moment, I’m not very interested in either shiny rocks or the financing to dig them out of the ground.
Important Information
This article is general research on gold royalty and streaming companies, written for educational purposes. It represents the author’s opinions as of the date of publication. It is not a recommendation to buy or sell any security or to adopt any investment strategy, and it does not constitute personalized investment, tax, or legal advice. Bormann Wealth Management, LLC is a registered investment adviser in the State of Washington. No advisory relationship is formed until a written agreement is signed by both parties. Read the full Disclosures.
Companies covered: Wheaton Precious Metals (WPM), Franco-Nevada (FNV), Royal Gold (RGLD), Triple Flag Precious Metals (TFPM) and OR Royalties (OR, formerly Osisko Gold Royalties).
Data and method: Company financials are from annual and quarterly filings (40-F, 10-K, 6-K and 10-Q) through Q3 2026, with management information circulars and proxy statements for executive pay. Prices are daily closes adjusted for dividends and splits from Yahoo Finance, January 2015 to November 16, 2026, for the five companies and the GLD, GDX, SLV and SPY exchange-traded funds. Sensitivity, correlation and volatility figures use weekly returns. Analysis assisted by Claude Opus 5.5.
Hypothetical results: The gold-implied returns and paths in this article are hypothetical, calculated from historical data. They don’t reflect actual trading, borrowing costs, transaction costs, taxes or fees, and neither the patterns found nor their absence is a guarantee of future results.
Limitations: Return on invested capital is calculated from reported financials, on assets carried at depleting historical cost, so it is not the same as a deal’s internal rate of return. Deployment totals combine reported annual and nine-month figures and are approximate. Triple Flag’s NYSE price history begins in August 2022 and OR Royalties’ in July 2016, so their statistics cover shorter periods. GLD stands in for the gold price and carries a small expense ratio. The comparison of the post-peak gap with other periods of the same length uses overlapping windows and a starting date chosen after the fact.
Note: Royalty and streaming companies are exposed to commodity prices, mine operators’ decisions, and the legal and political conditions of the countries where the mines operate, and their share prices can be considerably more volatile than the metals themselves. The named companies are illustrations of the analysis, not recommendations.
Positions and scope: As of last review date, the author, Nick Bormann, holds none of the named companies in his personal accounts but may buy or sell any security discussed at any time without notice. Bormann Wealth Management, LLC is a registered investment adviser and holds no positions in the securities discussed here.
Mark Twain is often attributed the quip, “a mine is a hole in the ground with a liar standing next to it” but after some research I couldn’t find any evidence that he ever wrote it. The closest parallel I could verify was: “A mine is a hole in the ground. The discoverer of it is a natural liar. The hole in the ground and the liar combine and issue shares and trap fools.” Detroit Free Press, 1881. The bitterness comes through even more strongly than Twain’s apocryphal line. ↩︎
E. C. Capen, R. V. Clapp and W. M. Campbell, “Competitive Bidding in High-Risk Situations,” Journal of Petroleum Technology 23, no. 6 (June 1971): 641-653. The paper introduced the term “winner’s curse” to describe overbidding on federal offshore oil and gas leases in the Gulf of Mexico. ↩︎
A new kind of bidder is adding pressure at the smaller end of the market. Tether, the issuer of the largest dollar stablecoin, has built stakes of 11-14% in Gold Royalty Corp., Metalla and Versamet, and controls 51.4% of Elemental Royalty, where it put up $100 million specifically to fund royalty acquisitions. Its money comes from interest earned on the reserves backing its tokens, and its stated goal is gold exposure, so it doesn’t need to earn a return measured in dollars the way the established royalty companies do. Tether’s purchases of Elemental Altus shares (June 2025) and the US$100 million placement tied to the Elemental-EMX merger (closed November 13, 2025), its 12.7% Versamet stake bought from Royal Gold (November 2025), and its Gold Royalty Corp. and Metalla stakes, are reported in company press releases and Schedule 13D filings. ↩︎
Royalty companies frequently bid on the same projects, and as a result may share economic interests in the same mines. In just the last couple of years, Spring Valley in Nevada picked up both a Wheaton stream and royalties bought by OR Royalties. The Koné project carries interests held by Wheaton and Triple Flag, Arthur by Franco-Nevada and Triple Flag, Eskay Creek by Franco-Nevada and Triple Flag, and Copper World by Wheaton and Franco-Nevada. ↩︎
As reported by Geomechanics.io, “Mining’s future is up for sale: streaming finance trade-offs for project teams” (2026), which also cites Wheaton’s 6-7% return hurdle. ↩︎
Failed mining operations still plague royalty companies. Triple Flag wrote off $184.9 million in 2023-24, including a stream on Nevada Copper that it valued at zero. OR Royalties has royalties on two mines that went through insolvency proceedings, Renard and Eagle. Franco-Nevada’s $1.17 billion impairment on Cobre Panama in 2023 came from a different risk, a host government closing the mine, but the effect on the stream holder was the same. ↩︎
The per-share results show why capital allocation incentives matter. Royal Gold’s 2025 acquisition of Sandstorm Gold and Horizon Copper raised its share count by 28.6% and its GEOs per share by about 5% so far. About 30% of the acquired value sits in development-stage assets, so more of the per-share benefit may arrive later, but for now the company has grown faster than each shareholder’s claim on its ounces. ↩︎